What is New Relic?
New Relic is an AI-powered observability platform that helps engineering teams see, understand, and fix issues across their entire tech stack—before users or revenue are impacted. Instead of just collecting data, it uses artificial intelligence to predict problems, explain root causes, and even suggest or automate fixes. Whether you're running traditional apps, cloud-native services, or cutting-edge AI agents, New Relic ties performance directly to business outcomes like customer satisfaction and cost.
Built on open standards like OpenTelemetry, New Relic unifies metrics, logs, traces, and user session data into a single, intelligent system. This means no more switching between siloed tools or drowning in alerts. With features like AI-driven session replay, real-time cloud cost tracking, and automated remediation via the SRE Agent, teams can move faster while staying secure and cost-efficient.
What are the features of New Relic?
- Intelligent Observability: Uses AI to predict, diagnose, and resolve incidents automatically—reducing mean time to resolution (MTTR).
- Full-Stack Visibility: Combines APM, infrastructure monitoring, logs, security, and digital experience in one unified platform.
- AI & Agentic Monitoring: Tracks AI model performance, token usage, hallucinations, and agent behavior in real time.
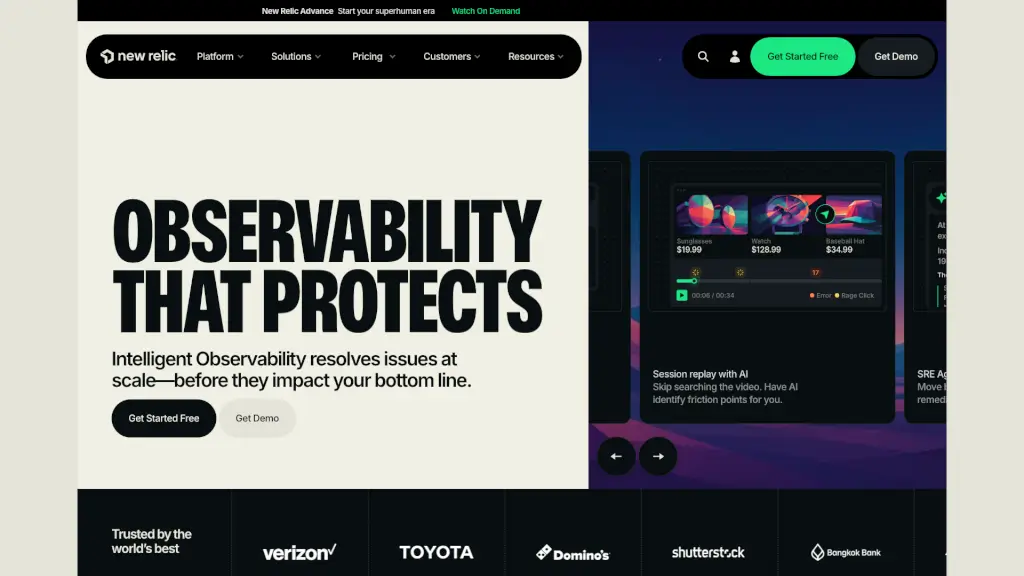
- Session Replay with AI: Automatically identifies user friction points in web and mobile sessions without manual video review.
- Cloud Cost Intelligence: Provides real-time visibility into multi-cloud and Kubernetes spending to prevent budget overruns.
- OpenTelemetry Native Support: Future-proof your observability with universal, vendor-neutral data collection.
- SRE Agent: Automates incident investigation and remediation using AI, going beyond simple alerting.
- Agentic Platform: Delivers actionable insights directly to engineers’ workflows (like Slack or Jira) via AI agents.
What are the use cases of New Relic?
- Proactively detect and fix performance issues in e-commerce apps before Black Friday traffic hits.
- Monitor AI-powered chatbots for accuracy drift, high latency, or unexpected token costs.
- Reduce cloud waste by identifying underused Kubernetes resources across AWS, Azure, and GCP.
- Pinpoint UX flaws—like form errors or slow checkout flows—using AI-analyzed session replays.
- Automate security vulnerability triage by correlating runtime context with business impact.
- Consolidate legacy monitoring tools (APM, logs, infra) into a single observability platform.
- Enable SREs to auto-remediate common incidents (e.g., restarting failed services) without human intervention.
How to use New Relic?
- Sign up for the free tier (includes 100 GB/month of data and unlimited basic users) at newrelic.com.
- Install the New Relic agent or configure OpenTelemetry to start sending metrics, logs, and traces.
- Use New Relic Explorer to navigate all telemetry data in one place—no pre-built dashboards needed.
- Enable AI Monitoring if you’re running LLMs or AI agents to track performance and cost.
- Set up Smart Alerts with dynamic baselines to reduce noise and focus on real issues.
- Explore pre-built solutions for your stack (e.g., Kubernetes, SAP, AWS) in the Integrations Marketplace.