Middleware Observability Platform logo

Middleware Observability Platform

4.0
(0 Reviews)
印度16.34%

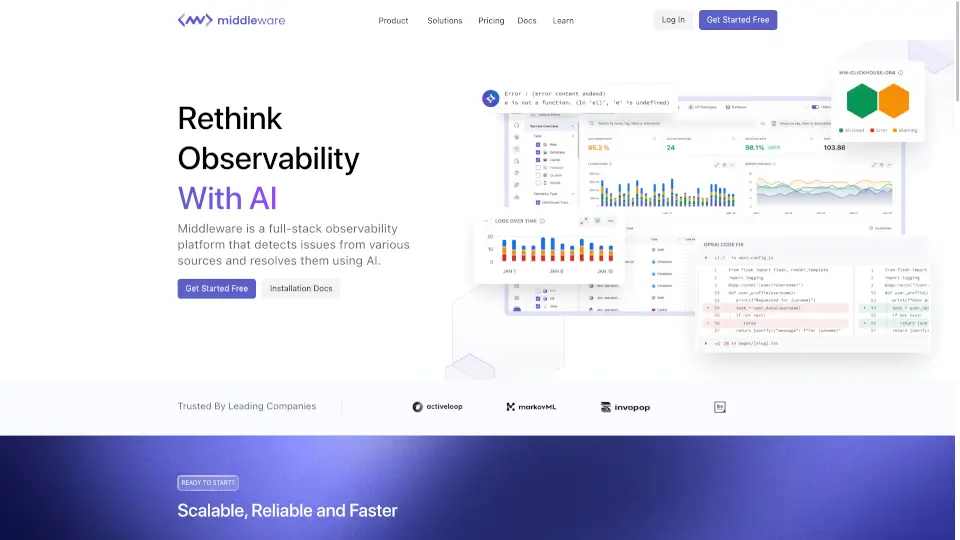
Middleware is a full-stack observability platform featuring an AI SRE Agent that automatically detects production issues, pinpoints root causes, and opens pull requests with fixes — all from a unified dashboard.

SeekTool 已驗證
社交媒體:
Middleware Observability Platform

Middleware Observability Platform 產品信息

What is Middleware Observability Platform?

Middleware is a full-stack observability platform that brings together logs, metrics, traces, and real-user monitoring in one place. Its standout feature is the OpsAI SRE Agent, an AI-powered assistant that automatically detects production issues, finds the root cause, and even opens a pull request with a fix. Whether you're tracking server health, debugging a slow API, or monitoring user experience, Middleware helps you catch problems before they turn into outages — without drowning in data or jumping between tools.

What are the features of Middleware Observability Platform?

  • OpsAI SRE Agent: AI agent that analyzes traces, logs, and real-user data to pinpoint the exact line of code causing an issue and auto-resolve it — often while you're still reading the alert.
  • Infrastructure Monitoring: Monitor servers, cloud instances, and overall infrastructure health in real time.
  • APM (Application Performance Monitoring): Track app performance, spot slowdowns, and pinpoint bottlenecks.
  • Log Monitoring: Debug faster with AI-powered log insights that surface patterns and errors.
  • Real User Monitoring (RUM): See exactly what your users experience — session replays, errors, and performance metrics.
  • Synthetic Monitoring: Test APIs and critical workflows to prevent outages before they happen.
  • Browser Testing: Run tests across browsers and devices to catch UI/UX issues early.
  • LLM Observability: Monitor and evaluate your LLM-powered applications for cost, performance, and accuracy.
  • Unified Telemetry: All signals live on a single timeline with automatic correlation by trace ID — no more jumping between dashboards.
  • Native OpenTelemetry Support: Instrument once, keep your data portable, and avoid vendor lock-in.

What are the use cases of Middleware Observability Platform?

  • Frontend to Backend Correlation: When a user reports a slow page, instantly trace the request from their browser to the backend server and find the failing database query.
  • Digital Experience Monitoring: Track real user sessions, error rates, and performance metrics across your web apps to improve UX.
  • Log Analysis and Correlation: Let AI scan millions of log lines and alert you only when something truly needs attention — no noise.
  • Endpoint Monitoring: Keep tabs on servers, containers, and cloud instances with no sampling, so you see everything.
  • Kubernetes Monitoring: Detect pod crashes (like CrashLoopBackOff or ImagePullBackOff) and get automatic diagnostics and fixes.
  • AWS / GCP / Azure Monitoring: Monitor your cloud infrastructure with 450+ out-of-the-box integrations.
  • Incident Auto-Resolution: OpsAI catches memory leaks, slow queries, or error spikes and opens a PR with the fix before your on-call engineer even wakes up.

How to use Middleware Observability Platform?

  1. Get started free: Head to Middleware's website and sign up for a free account.
  2. Install the lightweight agent: One command, one minute — no changes to your application code. Auto-instrumentation works across languages and frameworks.
  3. Configure integrations: Pick from 450+ built-in integrations (Kubernetes, AWS, Azure, GCP, databases, and more) or use OpenTelemetry for custom setups.
  4. Use plain English prompts: Ask OpsAI things like "show me my top 5 slowest endpoints" or "create a dashboard for error rates over time" — no query language needed.
  5. Let OpsAI auto-fix: When an issue is detected, the AI SRE Agent analyzes traces, logs, and RUM data, identifies the root cause, and can automatically open a pull request with the fix.
喜歡這個工具嗎?

按讚幫助更多人發現它!

Middleware Observability Platform 替代方案

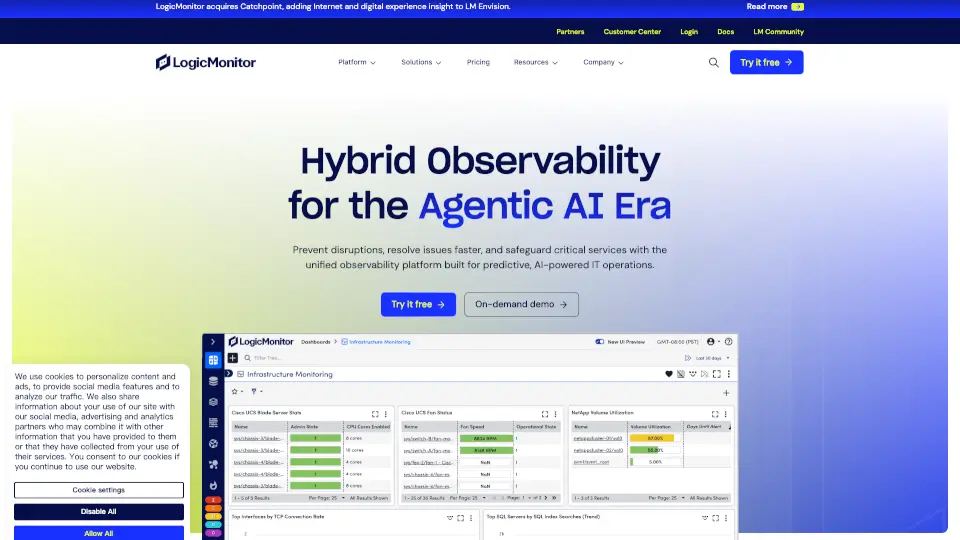
LogicMonitor

LogicMonitor 是一款 AI 驅動的混合可觀測性平台,幫助企業在多雲和本地環境中實現全面監控,提升運營效率。

US
49.88%
|
422.4K
|
5.0
Doctor Droid

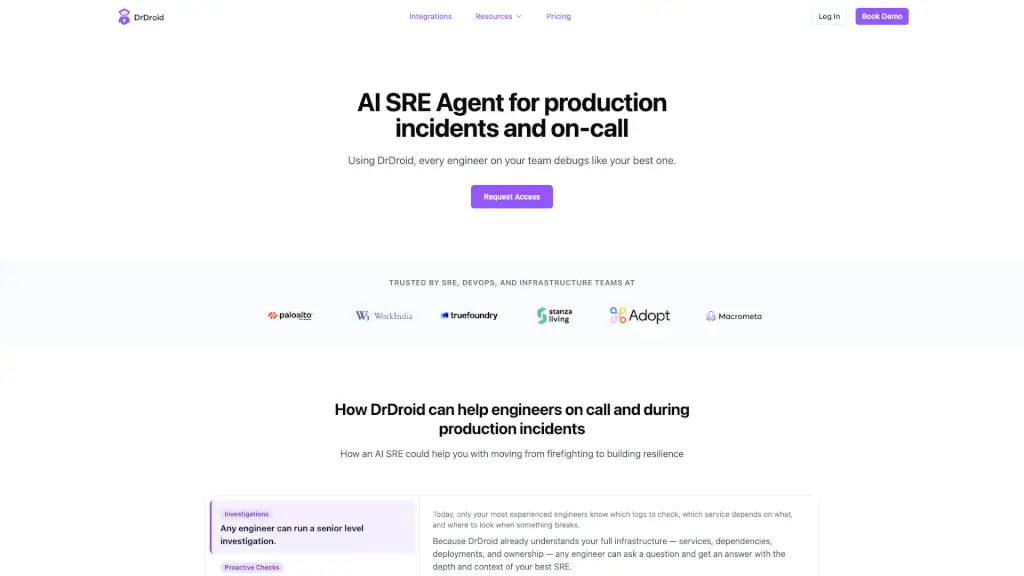
DrDroid 是一款 AI SRE 代理,讓每位工程師都能快速調查生產事故、自動化根本原因分析並主動提升系統韌性。

US
9.78%
|
127.2K
|
5.0
Dash0

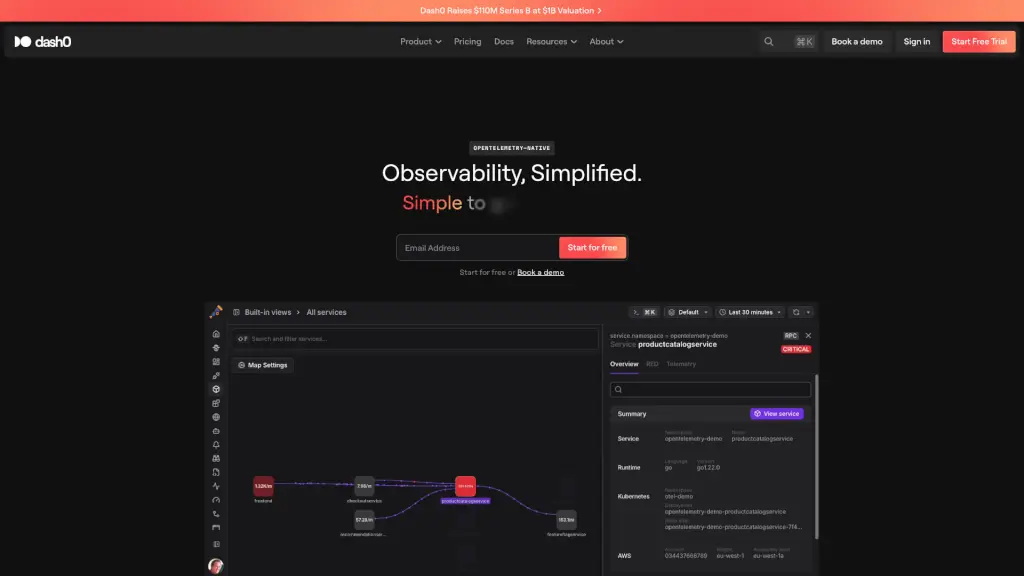
Dash0 是一個基於 OpenTelemetry 的現代可觀測性平台,提供統一日誌、指標與追蹤,搭配透明定價與開放標準,讓工程團隊快速獲得深度洞察。

DE
27.95%
|
197.9K
|
5.0
Langfuse

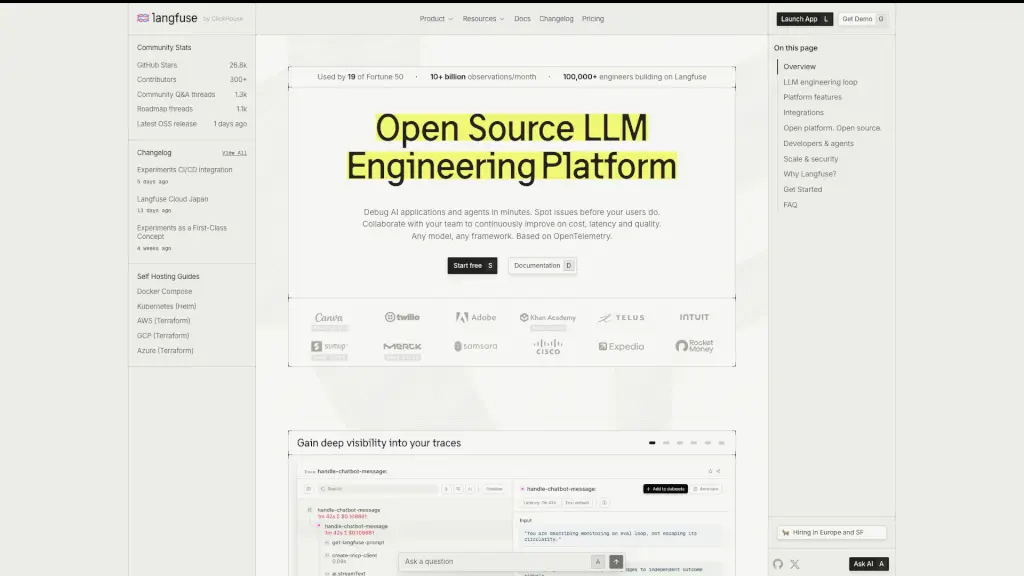
Langfuse 是一個開源 LLM 工程平台,整合追蹤、提示管理、評估與實驗功能,幫助團隊快速建構並持續優化 AI 應用。

US
17.36%
|
957.5K
|
5.0
Alfred AI

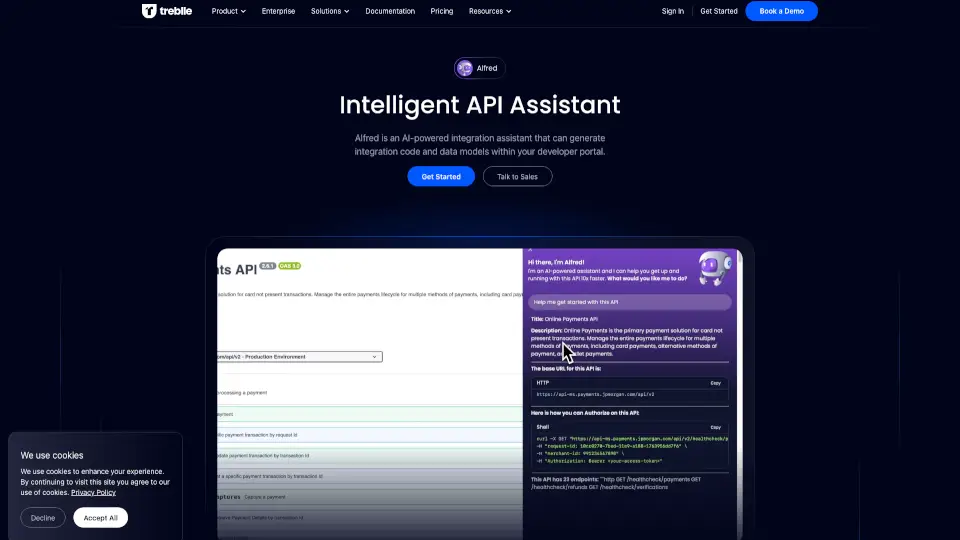
Treblle API Intelligence 整合全生命週期訊號,提供即時風險預警與統一視圖,讓企業全面掌控 API 健康與安全。

US
16.90%
|
28.6K
|
4.0
OpenMeter

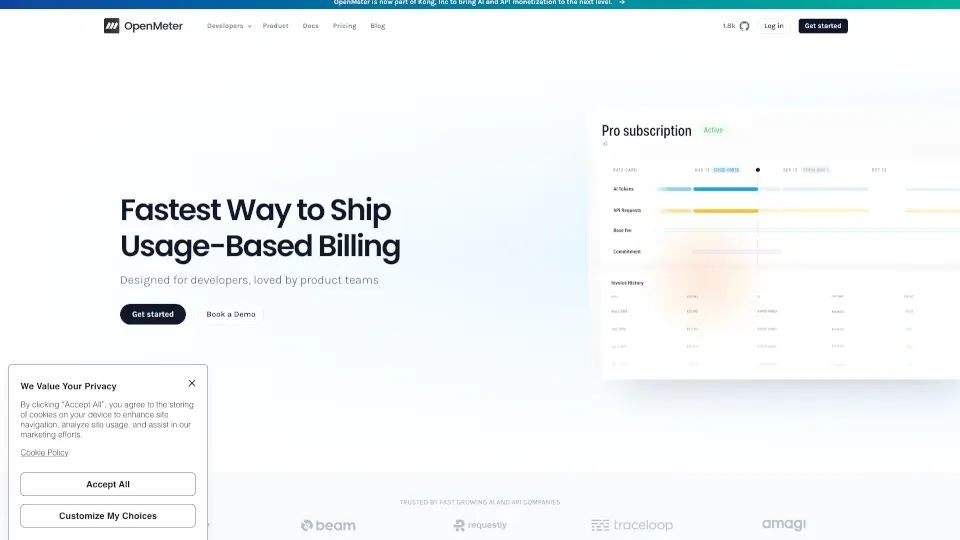
OpenMeter 是一個專為 AI 和開發工具公司設計的即時計費和使用量計量平台,支持靈活的定價模式和高可用性部署。

VN
38.01%
|
23.6K
|
4.0
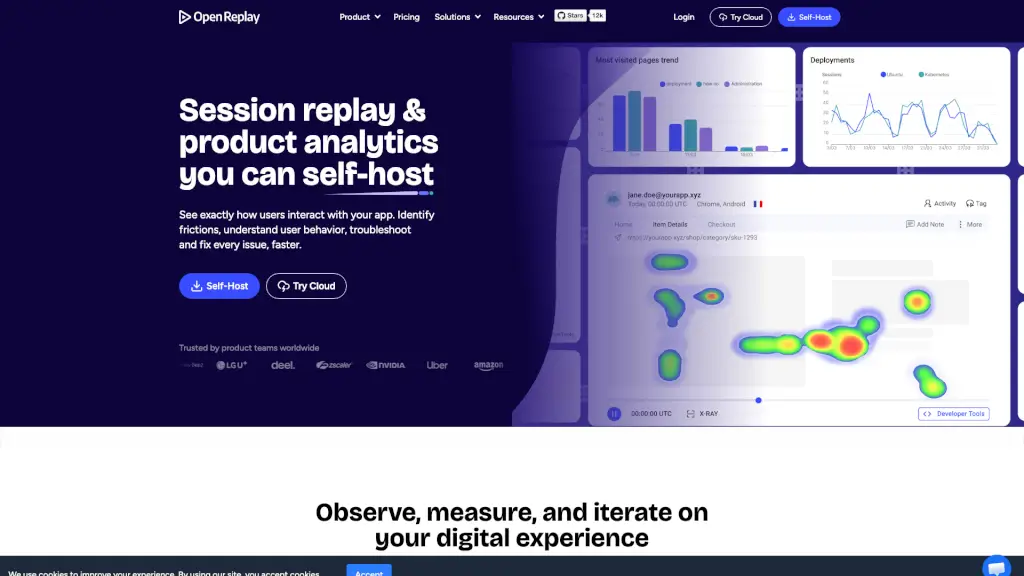
OpenReplay

OpenReplay 是一款開源、可自托管的會話重播與產品分析工具,讓團隊在保障資料隱私的前提下深入理解使用者行為。

US
5.79%
|
303.5K
|
5.0
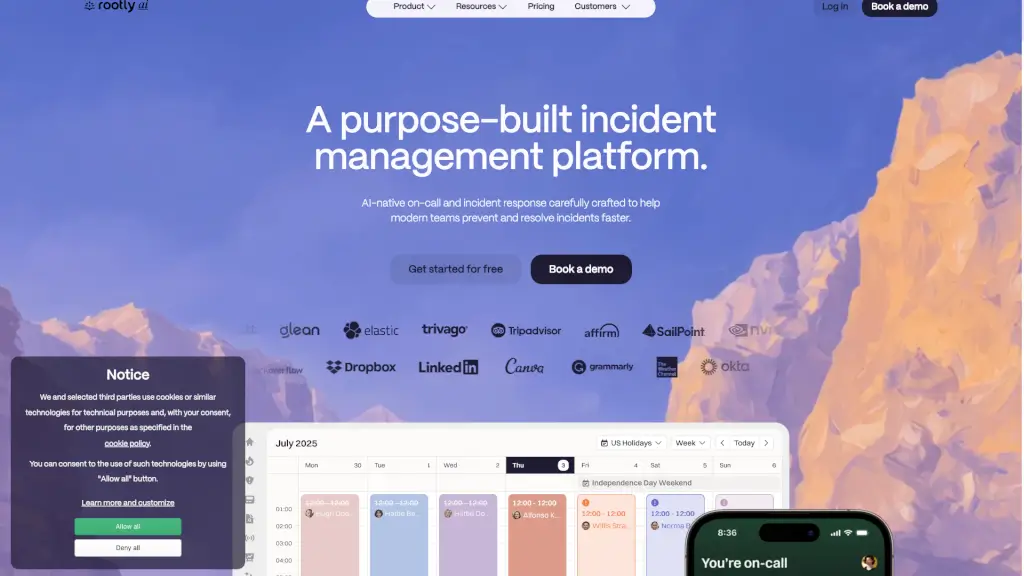
Rootly

Rootly 是一個全方位的事件管理平台,通過 AI 技術自動化診斷、建議修復方案和生成事後總結報告,幫助現代工程團隊更快地檢測、管理和解決事件。

US
35.95%
|
197.1K
|
5.0

Middleware Observability Platform 相關其他類別

Middleware Observability Platform 流量分析

💡 數據洞察

🌱
新興工具
月訪問量 1-10 萬,屬於小眾但可能有獨特價值,適合嘗鮮使用者。
⚠️
輕微下滑
近期流量有所下降,可能受季節或市場競爭影響。
👍
使用者體驗良好
跳出率 38%,使用者願意深入探索產品功能。
🌐
全球化分佈
使用者分佈較均衡,產品具有國際化特點。
  • 月訪問量

    42.83K

  • 跳出率

    38.06%

  • 頁面瀏覽量

    2.29

  • 訪問時長

    00:00:57

  • 全球排名

    713147

  • 國家排名

    185073

訪問量趨勢

流量來源

直接訪問43.34%
SearchOrganic42.07%
GenAi6.49%
郵件營銷6.22%
引薦鏈接1.88%
SocialOrganic0.00%
SearchPaid0.00%
SocialPaid0.00%
Affiliate0.00%

熱門關鍵詞

1
middleware
CPC$3.73
1.54K流量
2
logger format python
140流量
3
how prometheus internally works?
110流量
4
middlware
100流量
5
my master branch is way ahead of feature branch in gitlab
90流量

熱門地區

地區百分比
印度
印度
16.34%
美国
美国
13.31%
奈及利亞
奈及利亞
7.06%
英国
英国
6.43%
越南
越南
5.23%

資料來自 SimilarWeb

Middleware Observability Platform 常見問題

What exactly does the OpsAI SRE Agent do?

OpsAI is an AI-powered agent that monitors your production environment. When it detects an issue (like a memory leak or slow endpoint), it analyzes data from APM traces, real-user monitoring, and logs to pinpoint the exact line of code causing the problem. Then it can automatically open a pull request with a fix — so you don't have to spend hours debugging.

How long does it take to install Middleware?

Installation takes about a minute. You just run one command to deploy the lightweight agent, and it automatically instruments your apps. No need to change your code or manually add libraries.

Does Middleware sample or drop any data?

No, Middleware ingests all telemetry data — logs, metrics, and traces — without sampling. You get 100% visibility into what's happening in your stack.

How does Middleware correlate data from different signals?

Traces, logs, metrics, and frontend sessions are automatically linked by a common trace ID. So when you see a slow page load, you can click through to the exact log line and database query that caused it — all on a single timeline.

Can I ask questions in plain English instead of learning a query language?

Yes! Middleware lets you use AI prompts to generate dashboards, charts, or queries. Just type what you want to see, and the platform builds it for you. You can customize it later if needed.

What integrations are supported?

Middleware offers over 450 built-in integrations including Kubernetes, AWS, Google Cloud, Azure, databases, monitoring tools, and more. If you need something custom, OpenTelemetry support means you can instrument once and own your data forever.

Is Middleware secure enough for enterprise use?

Yes, Middleware is SOC 2, GDPR, ISO 27001, and HIPAA compliant. Your telemetry data is treated with the same care as your application code.

What kind of results have teams seen with Middleware?

One customer reported that Middleware reduced time spent debugging and resolving issues by nearly 90%. Another team said OpsAI automatically resolved about 60% of their production issues within the first few weeks.

Middleware Observability Platform 評論

0

0

0 評論
登錄to leave a review

最新評論

暫無評論

Middleware Observability Platform 定價

永久免費

免費使用所有功能,但有每月限制。
$0
  • 最多 100GB 數據
  • 最多 1k RUM 會話
  • 最多 20K 合成檢查
  • 無限用戶
  • 社區支持
  • 14 天數據保留

按需付費

僅支付您使用的部分,包含免費層級使用。
$0.3 每 GB 的指標、日誌、追蹤
  • 包含免費版所有功能
  • $1 每 1K RUM 會話
  • $1 每 5K 合成檢查
  • 數據攝入控制與數據管道
  • 專屬 Slack 頻道
  • 默認 30 天數據保留
  • SSO 與安全功能

企業版

享受批量折扣與高級支持,專為企業設計的解決方案。
客製化報價
  • 本地部署
  • 專屬帳戶團隊
  • 客製化數據保留
  • 多年合約折扣
  • 自帶雲端
  • 24x7 支持
  • 降低出口成本
  • 支持 Air gap 和 FedRAMP
  • 所有數據存於您的雲端
  • 高級數據安全

Middleware Observability Platform 嵌入

使用網站徽章為SeekTool.ai提供社群支持。它們很容易嵌入到您的首頁或頁腳中。

淺色
深色
Middleware Observability Platform - Featured on SeekTool.aiMiddleware Observability Platform - Featured on SeekTool.ai
如何安裝?

分類排行榜

按月流量排名