Middleware Observability Platform logo

Middleware Observability Platform

4.0
(0 Reviews)
India16.34%

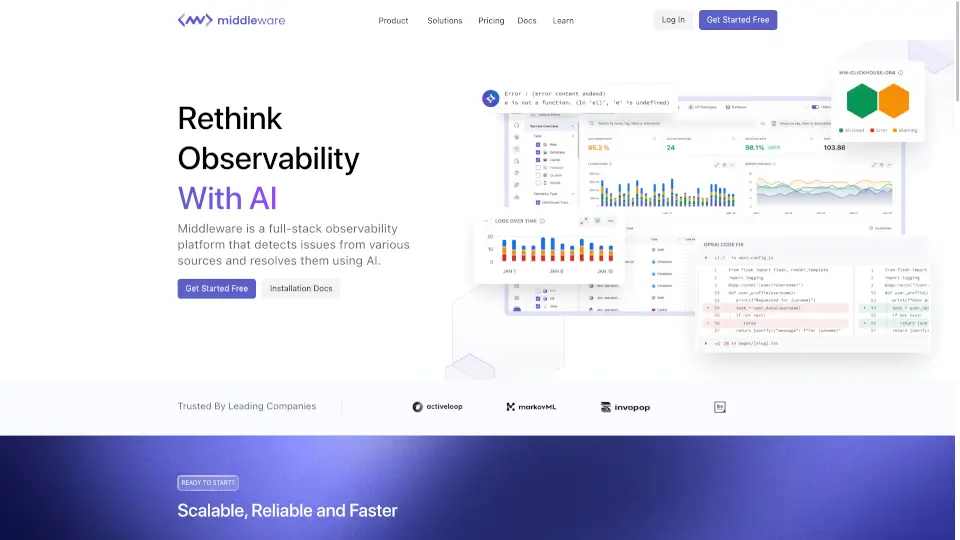
Middleware is a full-stack observability platform featuring an AI SRE Agent that automatically detects production issues, pinpoints root causes, and opens pull requests with fixes — all from a unified dashboard.

Verified by SeekTool
Social Media:
Middleware Observability Platform

Middleware Observability Platform Product Information

What is Middleware Observability Platform?

Middleware is a full-stack observability platform that brings together logs, metrics, traces, and real-user monitoring in one place. Its standout feature is the OpsAI SRE Agent, an AI-powered assistant that automatically detects production issues, finds the root cause, and even opens a pull request with a fix. Whether you're tracking server health, debugging a slow API, or monitoring user experience, Middleware helps you catch problems before they turn into outages — without drowning in data or jumping between tools.

What are the features of Middleware Observability Platform?

  • OpsAI SRE Agent: AI agent that analyzes traces, logs, and real-user data to pinpoint the exact line of code causing an issue and auto-resolve it — often while you're still reading the alert.
  • Infrastructure Monitoring: Monitor servers, cloud instances, and overall infrastructure health in real time.
  • APM (Application Performance Monitoring): Track app performance, spot slowdowns, and pinpoint bottlenecks.
  • Log Monitoring: Debug faster with AI-powered log insights that surface patterns and errors.
  • Real User Monitoring (RUM): See exactly what your users experience — session replays, errors, and performance metrics.
  • Synthetic Monitoring: Test APIs and critical workflows to prevent outages before they happen.
  • Browser Testing: Run tests across browsers and devices to catch UI/UX issues early.
  • LLM Observability: Monitor and evaluate your LLM-powered applications for cost, performance, and accuracy.
  • Unified Telemetry: All signals live on a single timeline with automatic correlation by trace ID — no more jumping between dashboards.
  • Native OpenTelemetry Support: Instrument once, keep your data portable, and avoid vendor lock-in.

What are the use cases of Middleware Observability Platform?

  • Frontend to Backend Correlation: When a user reports a slow page, instantly trace the request from their browser to the backend server and find the failing database query.
  • Digital Experience Monitoring: Track real user sessions, error rates, and performance metrics across your web apps to improve UX.
  • Log Analysis and Correlation: Let AI scan millions of log lines and alert you only when something truly needs attention — no noise.
  • Endpoint Monitoring: Keep tabs on servers, containers, and cloud instances with no sampling, so you see everything.
  • Kubernetes Monitoring: Detect pod crashes (like CrashLoopBackOff or ImagePullBackOff) and get automatic diagnostics and fixes.
  • AWS / GCP / Azure Monitoring: Monitor your cloud infrastructure with 450+ out-of-the-box integrations.
  • Incident Auto-Resolution: OpsAI catches memory leaks, slow queries, or error spikes and opens a PR with the fix before your on-call engineer even wakes up.

How to use Middleware Observability Platform?

  1. Get started free: Head to Middleware's website and sign up for a free account.
  2. Install the lightweight agent: One command, one minute — no changes to your application code. Auto-instrumentation works across languages and frameworks.
  3. Configure integrations: Pick from 450+ built-in integrations (Kubernetes, AWS, Azure, GCP, databases, and more) or use OpenTelemetry for custom setups.
  4. Use plain English prompts: Ask OpsAI things like "show me my top 5 slowest endpoints" or "create a dashboard for error rates over time" — no query language needed.
  5. Let OpsAI auto-fix: When an issue is detected, the AI SRE Agent analyzes traces, logs, and RUM data, identifies the root cause, and can automatically open a pull request with the fix.
Do you like this tool?

Upvote to help others discover it!

Middleware Observability Platform Alternatives

LogicMonitor

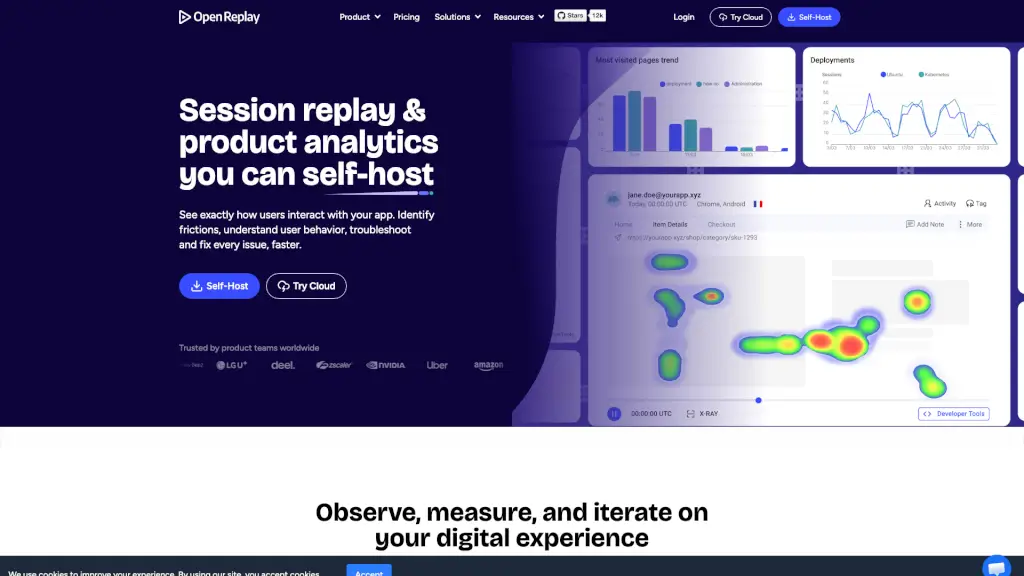
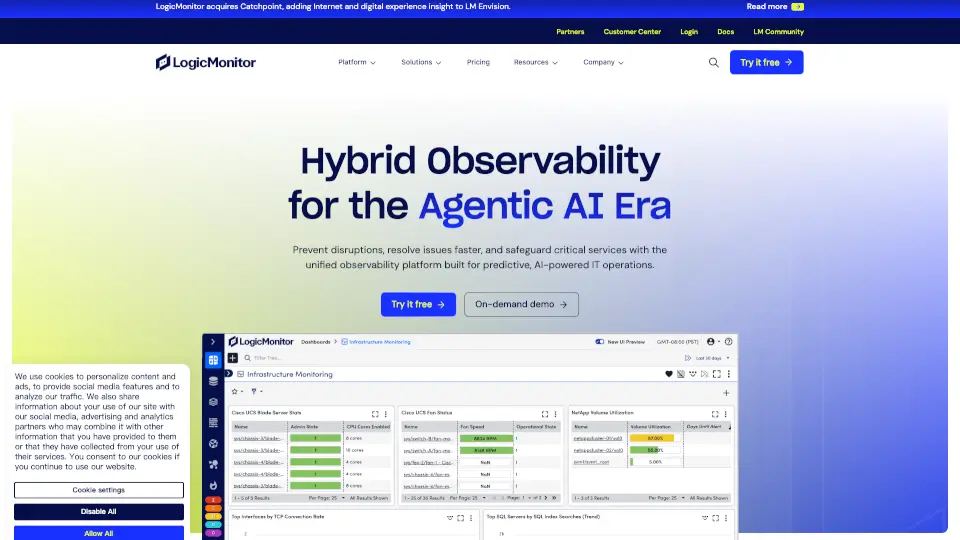
LogicMonitor is a hybrid observability platform that simplifies IT monitoring with AI-driven insights, multi-cloud support, and seamless integrations.

US
49.88%
|
422.4K
|
5.0
Doctor Droid

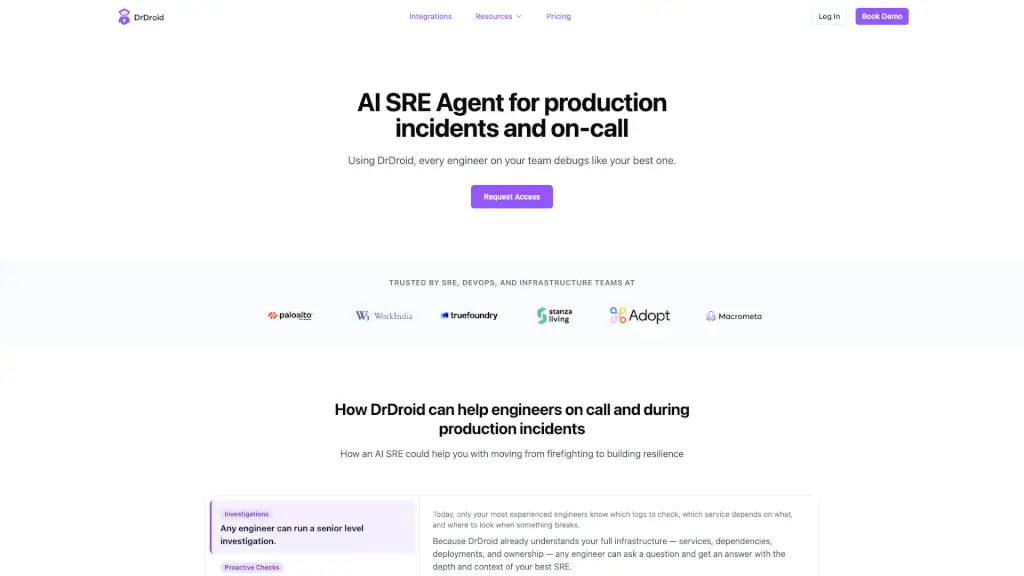
DrDroid is an AI SRE agent that empowers every engineer to resolve production incidents faster with automated root cause analysis, proactive checks, and institutional knowledge—no escalations needed.

US
9.78%
|
127.2K
|
5.0
Dash0

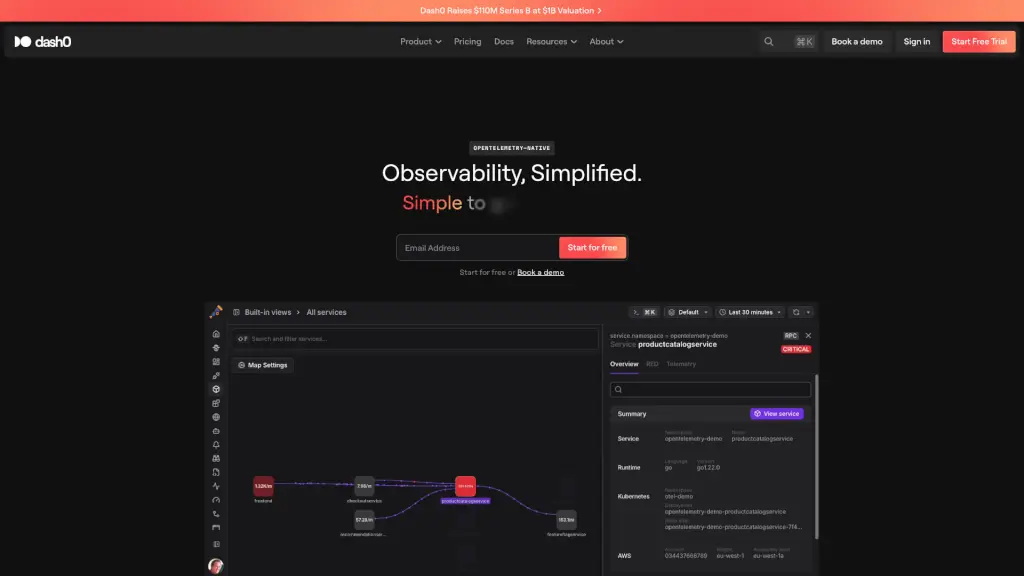
Dash0 delivers OpenTelemetry-native observability with unified logs, metrics, and traces, transparent pricing, and zero vendor lock-in—so teams get deep insights fast without complexity.

DE
27.95%
|
197.9K
|
5.0
Langfuse

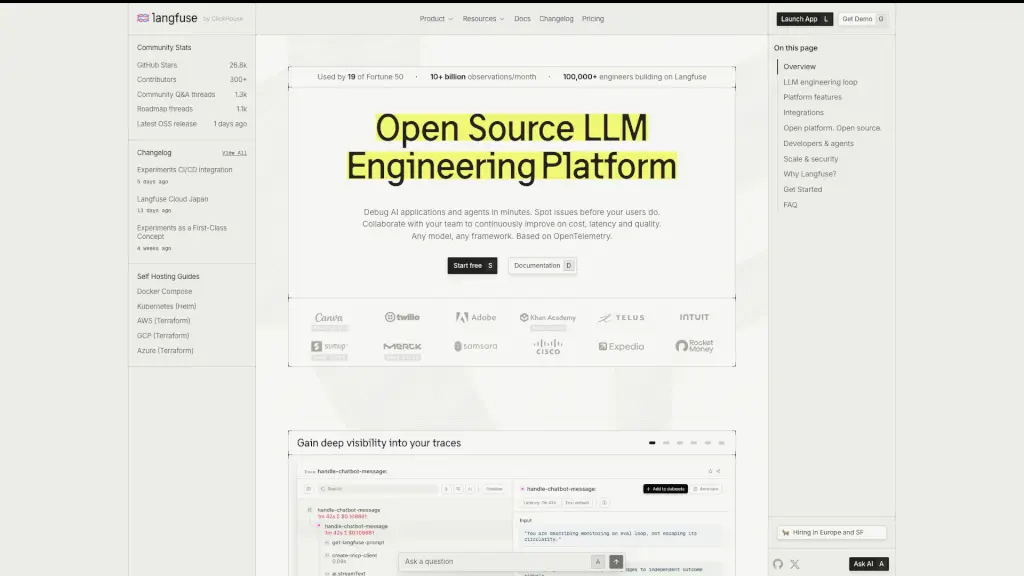
Langfuse is an open-source LLM engineering platform that unifies tracing, prompt management, evaluations, and experiments to help teams build and improve AI applications faster.

US
17.36%
|
957.5K
|
5.0
Alfred AI

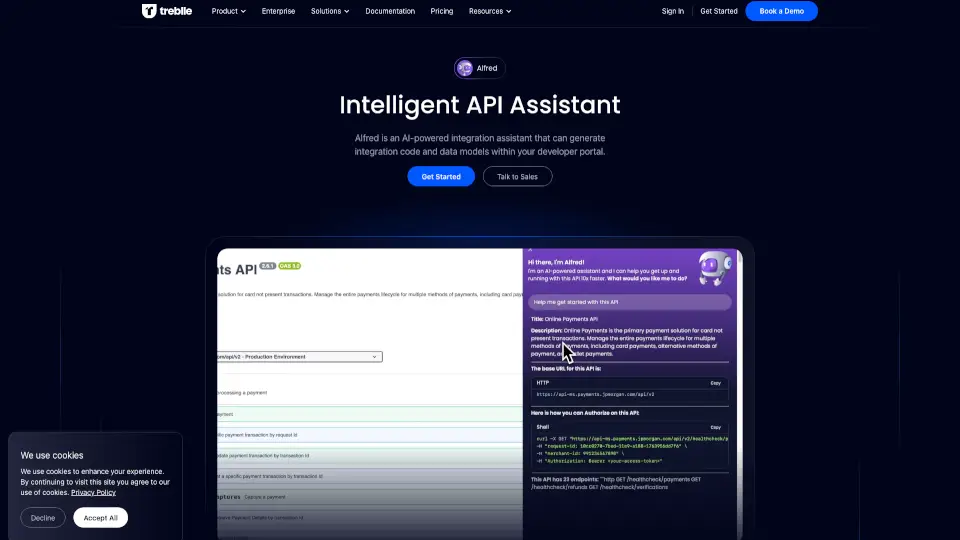
Treblle API Intelligence unifies discovery, security, performance, and design data into one real-time view to predict risks and simplify API management across your entire organization.

US
16.90%
|
28.6K
|
4.0
OpenMeter

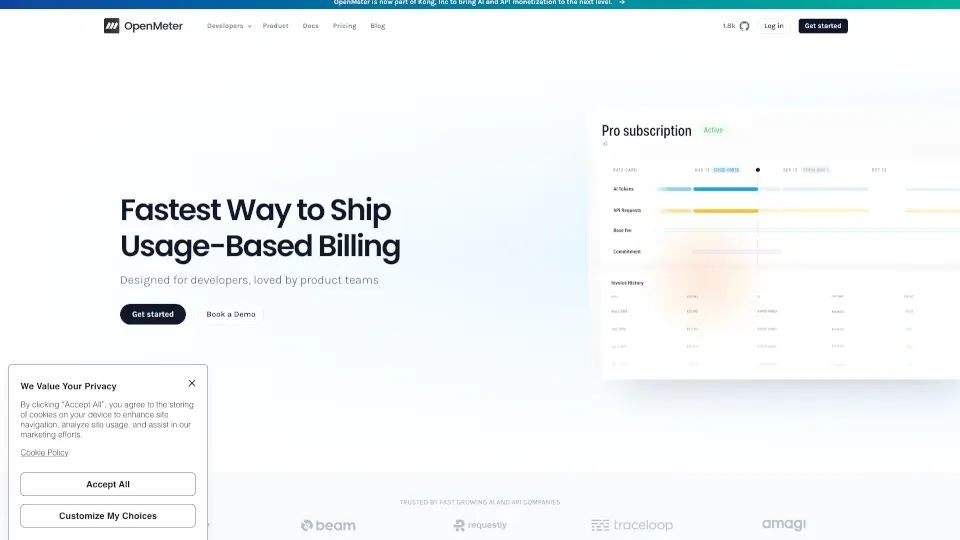
OpenMeter is the go-to solution for usage-based billing and metering, offering real-time tracking, flexible pricing, and seamless integrations. Perfect for AI and DevTool companies looking to scale their revenue operations.

VN
38.01%
|
23.6K
|
4.0
OpenReplay

OpenReplay is a self-hosted, open-source session replay and product analytics platform that gives teams full control over user interaction data while delivering deep debugging and behavioral insights.

US
5.79%
|
303.5K
|
5.0
Rootly

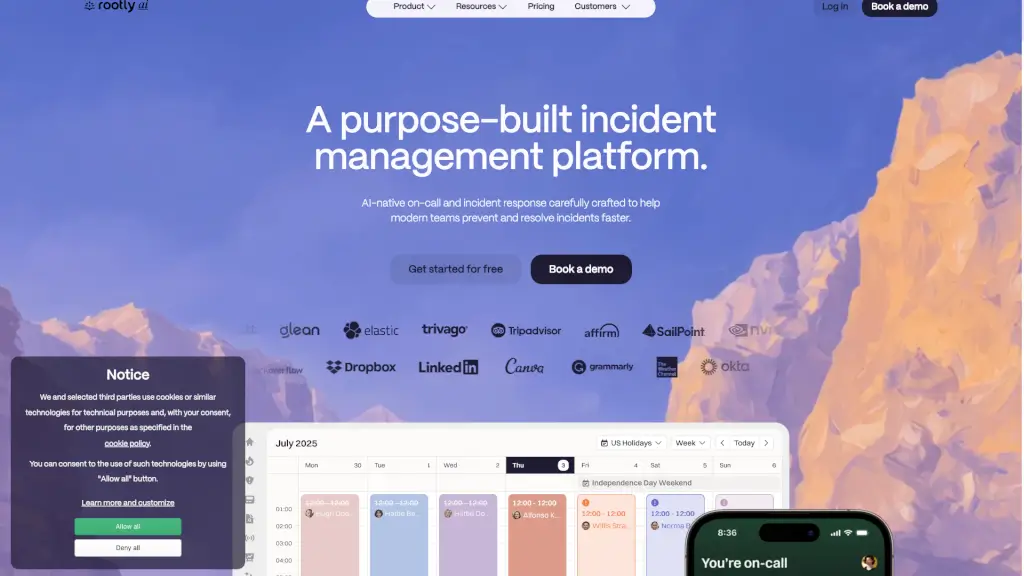
Rootly is an AI-native platform that helps engineering teams detect, manage, and resolve incidents faster, with features like automated root cause analysis, on-call management, and seamless integrations.

US
35.95%
|
197.1K
|
5.0

Middleware Observability Platform Related Other Categories

Middleware Observability Platform Traffic Analysis

💡 Insights

🌱
Emerging Tool
10K-100K monthly visits. Niche or new tool with potential unique value.
⚠️
Slight Decline
Traffic has slightly decreased recently.
👍
Good Experience
Bounce rate of 38%. Users are willing to explore features.
🌐
Global Reach
Balanced user distribution worldwide.
  • Monthly Visits

    42.83K

  • Bounce Rate

    38.06%

  • Pages Per Visit

    2.29

  • Visit Duration

    00:00:57

  • Global Rank

    713147

  • Country Rank

    185073

Visits Over Time

Traffic Sources

Direct43.34%
SearchOrganic42.07%
GenAi6.49%
Mail6.22%
Referrals1.88%
SocialOrganic0.00%
SearchPaid0.00%
SocialPaid0.00%
Affiliate0.00%

Top Keywords

1
middleware
CPC$3.73
1.54KTraffic
2
logger format python
140Traffic
3
how prometheus internally works?
110Traffic
4
middlware
100Traffic
5
my master branch is way ahead of feature branch in gitlab
90Traffic

Top Regions

RegionPercentage
India
India
16.34%
United States
United States
13.31%
Nigeria
Nigeria
7.06%
United Kingdom
United Kingdom
6.43%
Vietnam
Vietnam
5.23%
Low
High

Powered by SimilarWeb

Middleware Observability Platform FAQ

What exactly does the OpsAI SRE Agent do?

OpsAI is an AI-powered agent that monitors your production environment. When it detects an issue (like a memory leak or slow endpoint), it analyzes data from APM traces, real-user monitoring, and logs to pinpoint the exact line of code causing the problem. Then it can automatically open a pull request with a fix — so you don't have to spend hours debugging.

How long does it take to install Middleware?

Installation takes about a minute. You just run one command to deploy the lightweight agent, and it automatically instruments your apps. No need to change your code or manually add libraries.

Does Middleware sample or drop any data?

No, Middleware ingests all telemetry data — logs, metrics, and traces — without sampling. You get 100% visibility into what's happening in your stack.

How does Middleware correlate data from different signals?

Traces, logs, metrics, and frontend sessions are automatically linked by a common trace ID. So when you see a slow page load, you can click through to the exact log line and database query that caused it — all on a single timeline.

Can I ask questions in plain English instead of learning a query language?

Yes! Middleware lets you use AI prompts to generate dashboards, charts, or queries. Just type what you want to see, and the platform builds it for you. You can customize it later if needed.

What integrations are supported?

Middleware offers over 450 built-in integrations including Kubernetes, AWS, Google Cloud, Azure, databases, monitoring tools, and more. If you need something custom, OpenTelemetry support means you can instrument once and own your data forever.

Is Middleware secure enough for enterprise use?

Yes, Middleware is SOC 2, GDPR, ISO 27001, and HIPAA compliant. Your telemetry data is treated with the same care as your application code.

What kind of results have teams seen with Middleware?

One customer reported that Middleware reduced time spent debugging and resolving issues by nearly 90%. Another team said OpsAI automatically resolved about 60% of their production issues within the first few weeks.

Middleware Observability Platform Reviews

0

0

0 Reviews
Sign Into leave a review

Recent Reviews

No reviews yet

Middleware Observability Platform Pricing

Free Forever

Free access to all features with monthly limits.
$0
  • Up to 100GB Data
  • Up to 1k RUM Sessions
  • Up to 20K Synthetic Checks
  • Unlimited Users
  • Community Based Support
  • 14 day retention

Pay As You Go

Pay only for what you use, with free tier usage included.
$0.3 per GB of metrics, logs, traces
  • Everything in Free
  • $1 per 1K RUM Sessions
  • $1 per 5K Synthetic Checks
  • Ingestion Control & Data Pipeline
  • Dedicated Slack Channel
  • Default 30 day retention
  • SSO and Security Features

Enterprise

Enjoy volume discounts and premium support with our enterprise solutions.
Custom Pricing
  • On-Premise Deployment
  • Dedicated Account Team
  • Custom Data Retention
  • Multi-year Contract Discounts
  • Bring Your Own Cloud
  • 24x7 Support
  • Reduce Egress Cost
  • Air gap and FedRAMP supported
  • All Data in Your Cloud
  • Advanced Data Security

Middleware Observability Platform Embed

Use website badges to drive community support for SeekTool.ai. They are easy to embed in your homepage or footer.

Light
Dark
Middleware Observability Platform - Featured on SeekTool.aiMiddleware Observability Platform - Featured on SeekTool.ai
How to install?

Category Rankings

Ranked by monthly traffic