Best Data Visualization Tools & Software in 2026 (Free & Paid)
AI tools that transform raw data into visual contexts like charts, graphs, and maps to help people understand data significance.
Similar Categories
All Tools
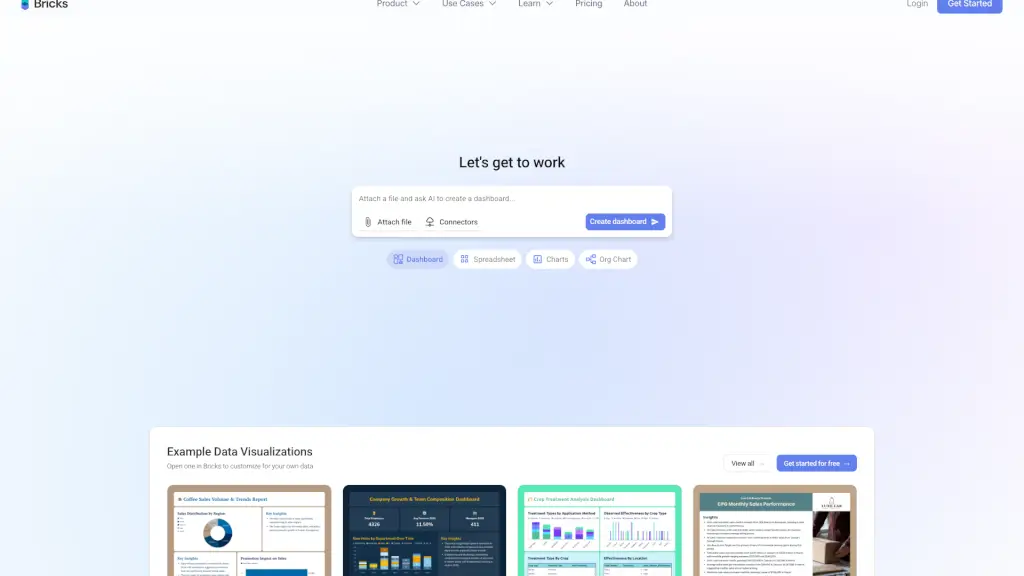
Bricks transforms CSV and Excel files into AI-generated dashboards, reports, and presentations in seconds—no expertise needed.
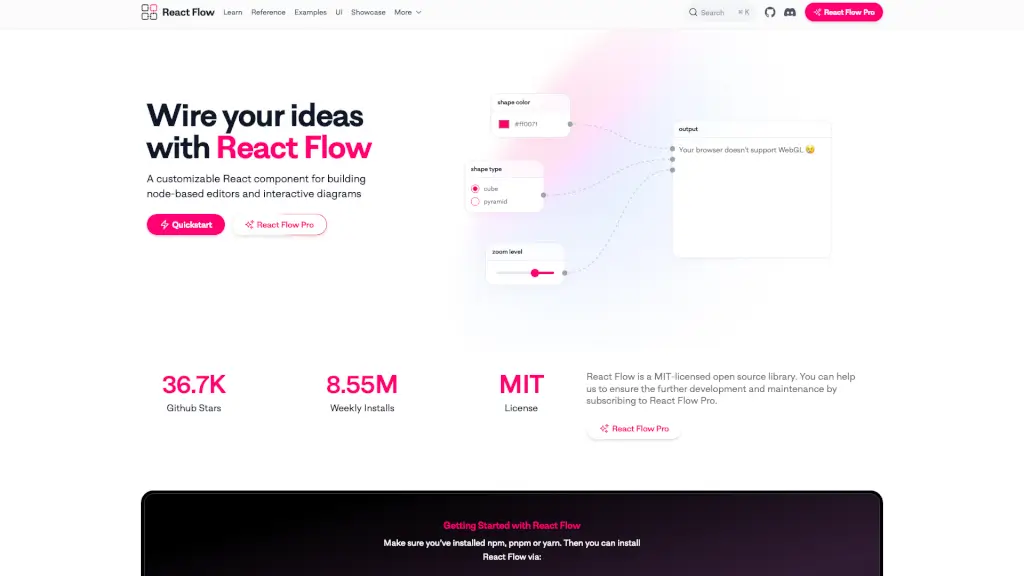
React Flow is a highly customizable React library for building interactive node-based UIs like workflow editors, no-code apps, and visual programming tools.

Energent.ai is an AI data analyst that transforms spreadsheets, PDFs, scans, and web content into actionable insights and ready-to-share deliverables with just one prompt.
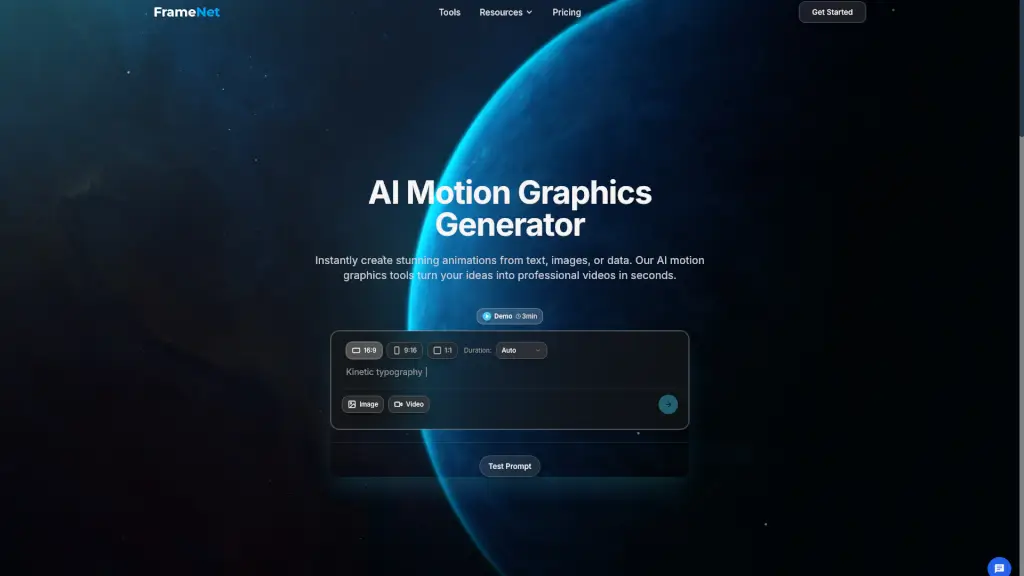
FrameNet is an AI Motion Graphics Designer and Generator that lets you create stunning animated motion graphics instantly, perfect for designers, marketers, and content creators.
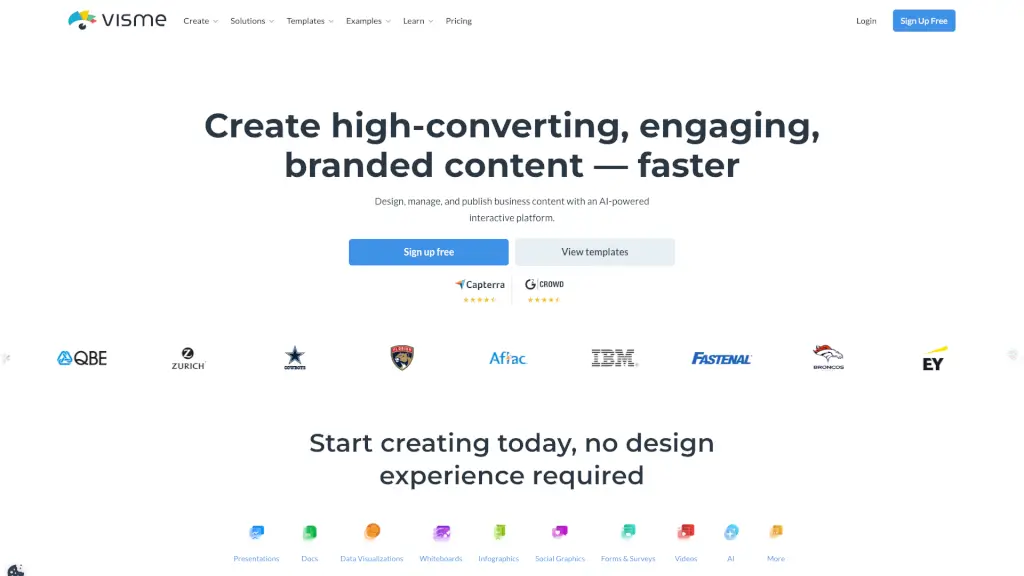
Visme is an all-in-one design platform that helps you create professional presentations, infographics, and one-pagers with ease, even if you have no design experience.
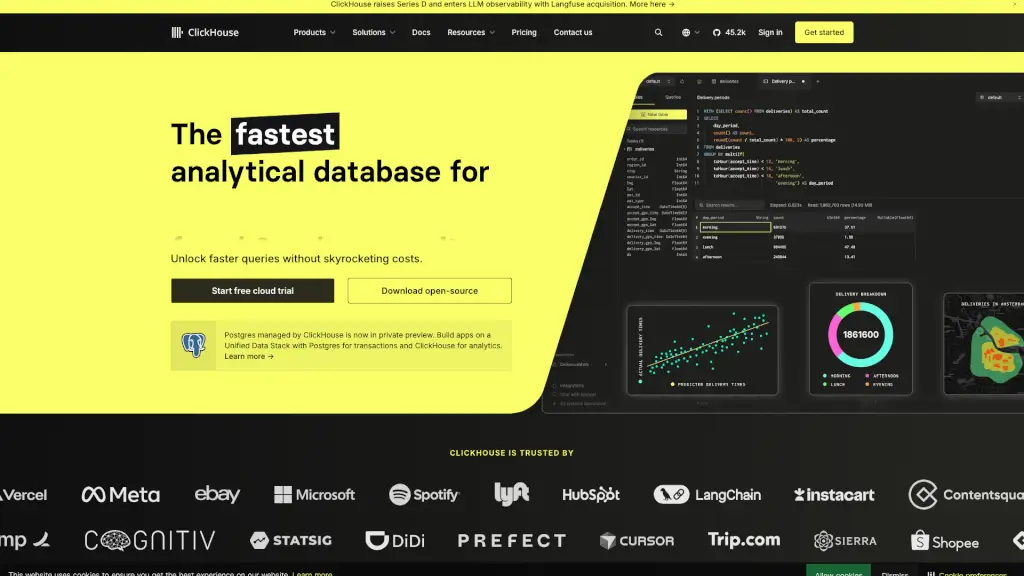
ClickHouse is a fast, open-source OLAP database for real-time analytics, offering high performance and cost efficiency.
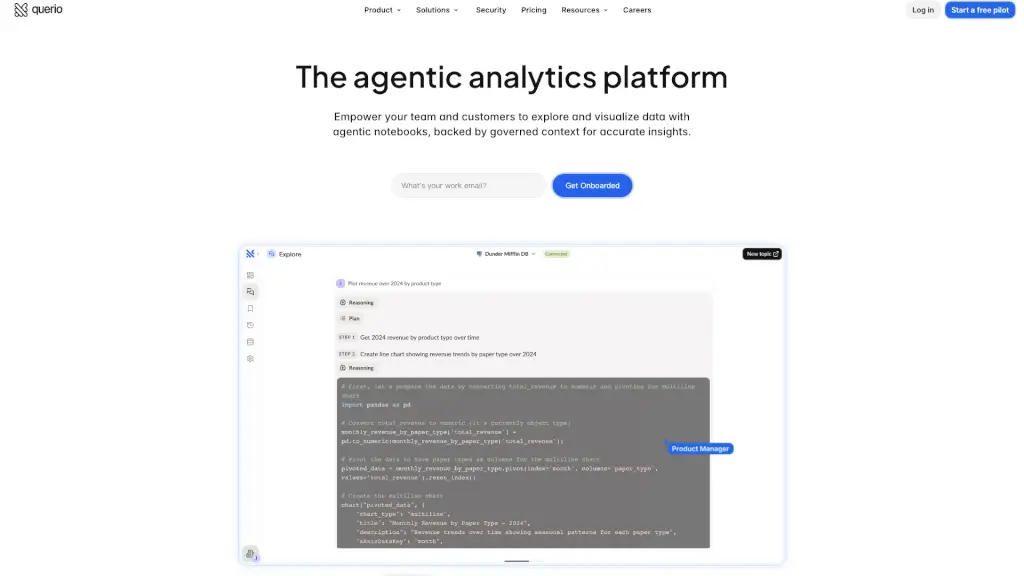
Querio is the data platform that empowers teams and customers to explore and visualize data with agentic notebooks, delivering instant, accurate insights.
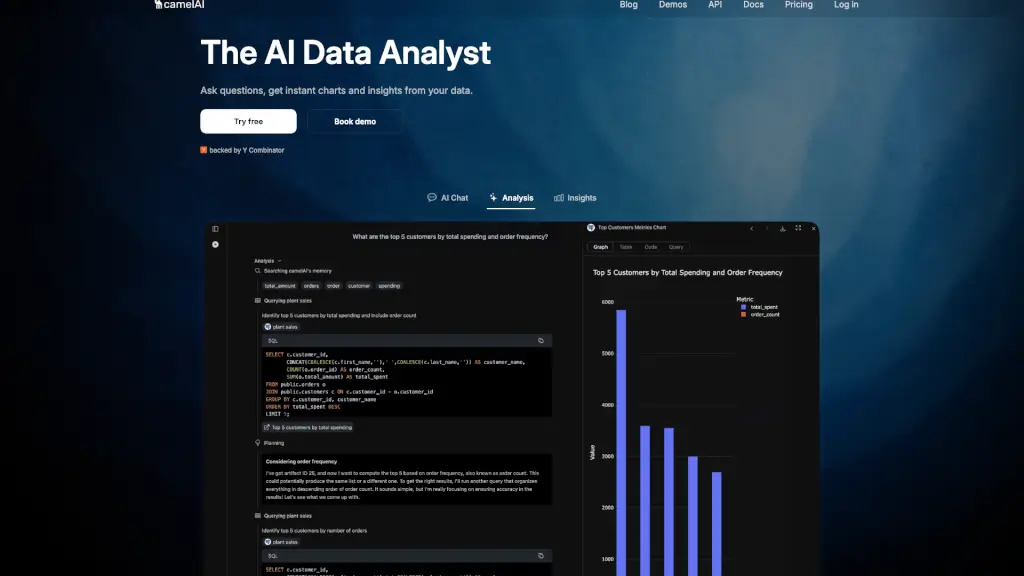
camelAI is an AI-powered data analysis tool that turns plain English questions into instant charts and insights, making business intelligence accessible to everyone.
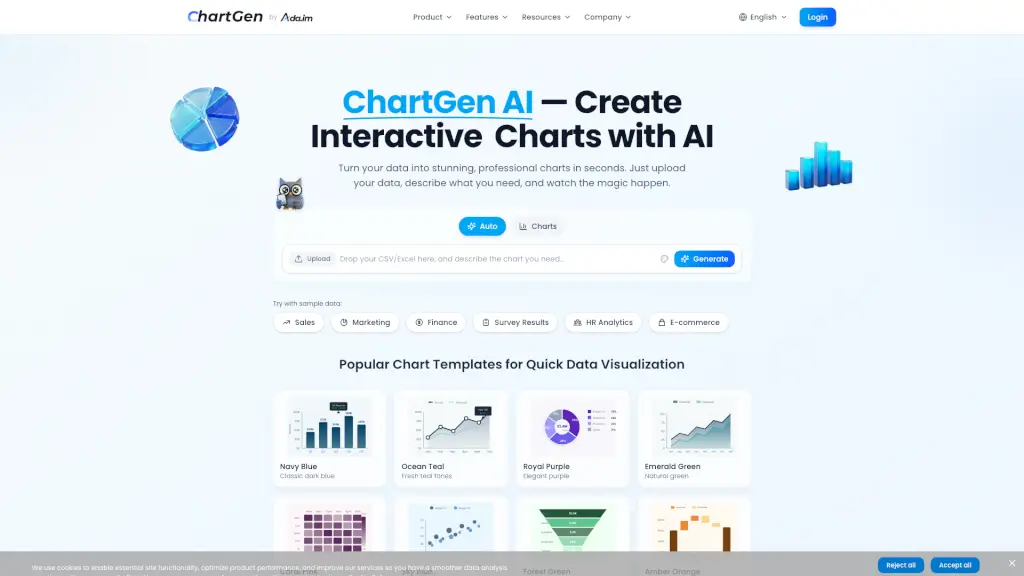
ChartGen AI is a free, AI-powered chart generator that turns your data into professional, customizable charts in seconds, making data visualization easy and accessible for everyone.
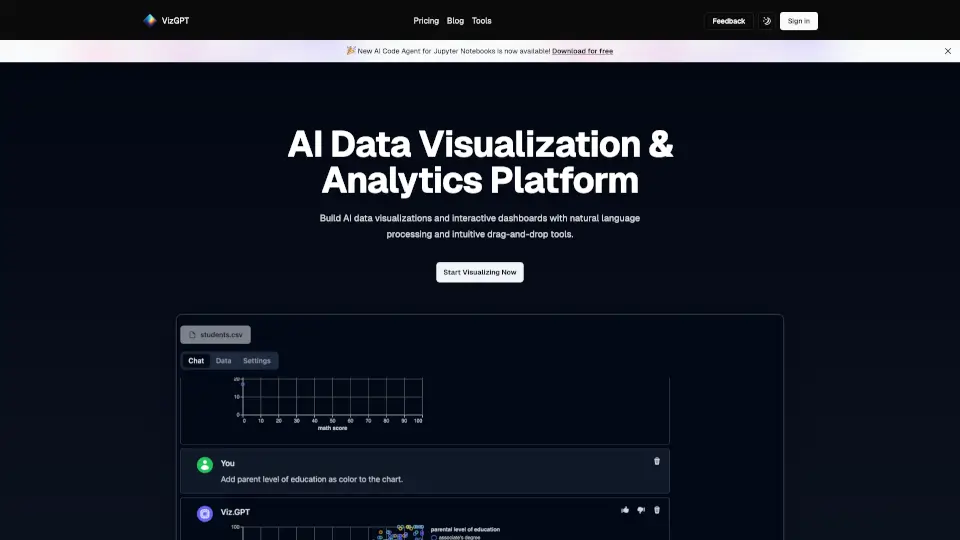
vizGPT turns your data into interactive charts and analytics dashboards using natural language and drag-and-drop tools, making data analysis easy and fast.
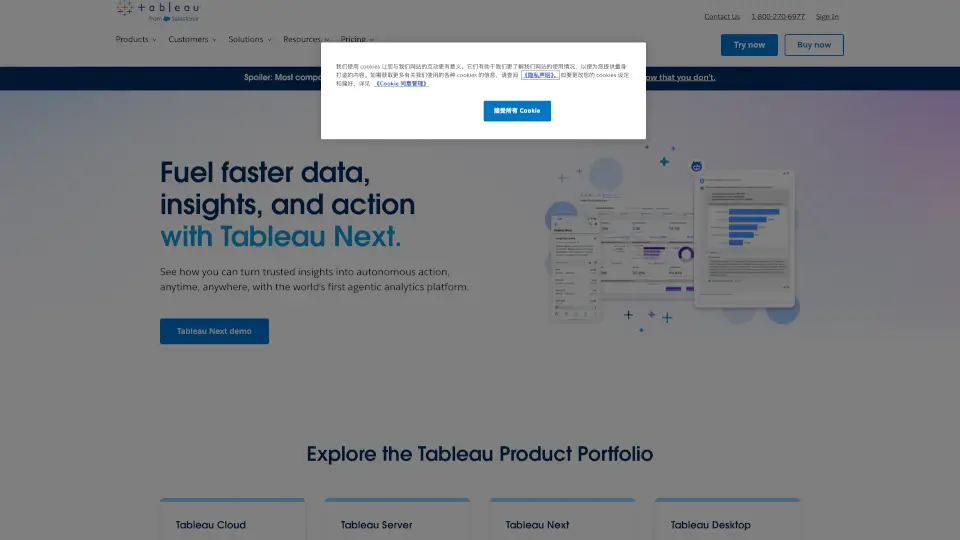
Tableau is a user-friendly business intelligence and analytics software that helps you connect to data, create visualizations, and share insights with ease, making data-driven decisions accessible to everyone.
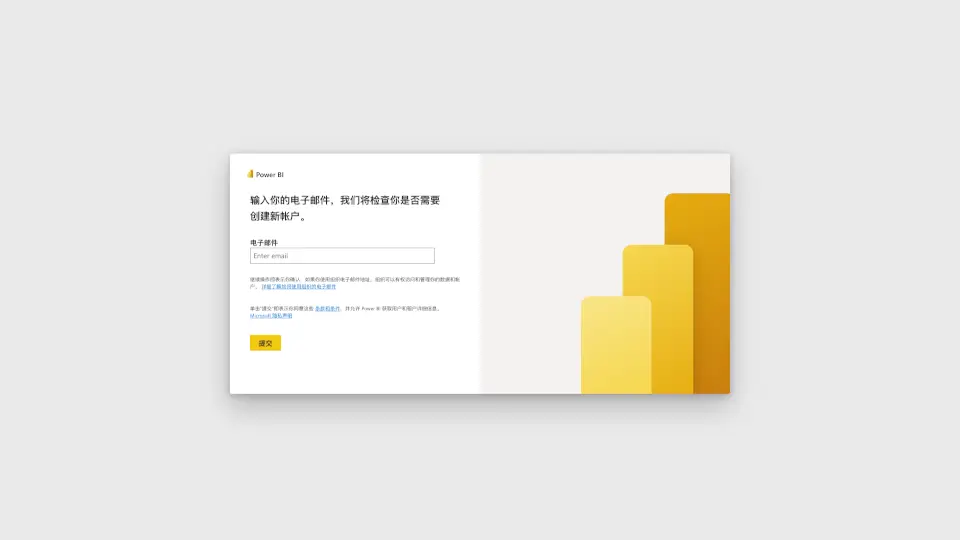
Microsoft Power BI is a versatile business analytics tool that transforms raw data into meaningful insights through interactive visualizations, detailed reports, and real-time dashboards, empowering better decision-making.