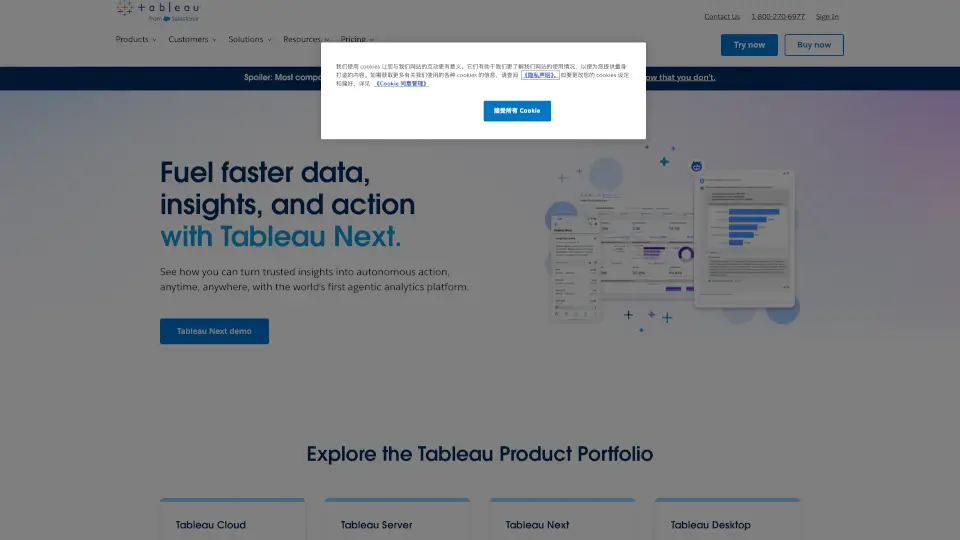
Was ist Tableau?
Tableau ist eine leistungsstarke Business-Intelligence- und Analysetool, das es dir ermöglicht, deine Daten auf einfache und visuell ansprechende Weise zu verstehen. Ob du nun ein Geschäftsführer bist, der wichtige Entscheidungen treffen muss, oder ein Analyst, der tief in die Daten eintauchen möchte – Tableau bietet dir die Werkzeuge, um deine Daten zu visualisieren und zu analysieren. Mit Tableau kannst du fast jede Datenquelle verbinden, einfach per Drag-and-Drop Visualisierungen erstellen und diese mit einem Klick teilen.
Was sind die Merkmale von Tableau?
- Datenverbindung: Verbinde dich nahtlos mit fast jeder Datenquelle, sei es eine lokale Datenbank, eine Cloud-Lösung oder externe APIs.
- Drag-and-Drop-Visualisierung: Erstelle beeindruckende Diagramme und Berichte, indem du einfach Elemente per Drag-and-Drop platzierst.
- Teilen und Zusammenarbeit: Teile deine Analysen und Dashboards mit deinem Team oder Kunden, egal wo sie sich befinden.
- Tableau Cloud: Eine vollständig gehostete, cloudbasierte Analyseplattform, die es dir ermöglicht, deine Daten ohne Server-Management zu analysieren.
- Tableau Server: Eine selbstgehostete Lösung, die dir volle Kontrolle über deine Daten und Analysen gibt, ob lokal oder in der Cloud.
- Tableau Next: Eine offene Analyseplattform, die künstliche Intelligenz, vertrauenswürdige Daten und direkte Workflow-Integration kombiniert, um Insights schneller in Aktionen umzusetzen.
Was sind die Anwendungsfälle von Tableau?
- Geschäftsberichterstattung: Erstelle interaktive Dashboards, um Geschäftsleistung und KPIs zu visualisieren.
- Datenanalyse für Marketing: Analysiere Kampagnendaten, um die Effektivität deiner Marketingstrategien zu verbessern.
- Finanzanalyse: Verfolge Finanzdaten und erstelle detaillierte Berichte, um bessere finanzielle Entscheidungen zu treffen.
- Kundenservice: Überwache Kundenservice-Metriken, um die Kundenzufriedenheit zu steigern.
- Produktionsmanagement: Analysiere Produktionsdaten, um Prozesse zu optimieren und Kosten zu senken.
- Personalmanagement: Verwalte Personalressourcen und verfolge Leistungsindikatoren, um effizienter zu arbeiten.
Wie benutzt man Tableau?
- Datenquelle verbinden: Wähle die Datenquelle aus, die du verwenden möchtest, und stelle die Verbindung her.
- Daten importieren: Importiere deine Daten in Tableau, indem du sie entweder hochlädst oder direkt von der Datenquelle holst.
- Visualisierung erstellen: Ziehe die gewünschten Felder in den Arbeitsbereich, um Diagramme und Tabellen zu erstellen.
- Dashboard erstellen: Füge mehrere Visualisierungen in ein Dashboard zusammen, um einen umfassenden Überblick zu erhalten.
- Teilen und veröffentlichen: Teile dein Dashboard mit anderen, indem du es publizierst oder als Link versendest.