Best Data Visualization Tools & Software in 2026 (Free & Paid)
AI tools that transform raw data into visual contexts like charts, graphs, and maps to help people understand data significance.
Similar Categories
All Tools
Hex Magic is the ultimate tool for faster, smarter data analysis, powered by AI. It’s perfect for data scientists, analysts, and anyone who loves exploring data.
QPR ProcessAnalyzer is the ultimate tool for businesses looking to optimize their processes, reduce risks, and drive digital transformation with real-time insights.
FiftyOne empowers AI builders to create high-quality datasets and accurate models, saving time and boosting productivity.
Graphy is the ultimate tool for creating beautiful, actionable graphs in seconds. With AI-powered insights and a user-friendly interface, it’s perfect for teams, businesses, and content creators.
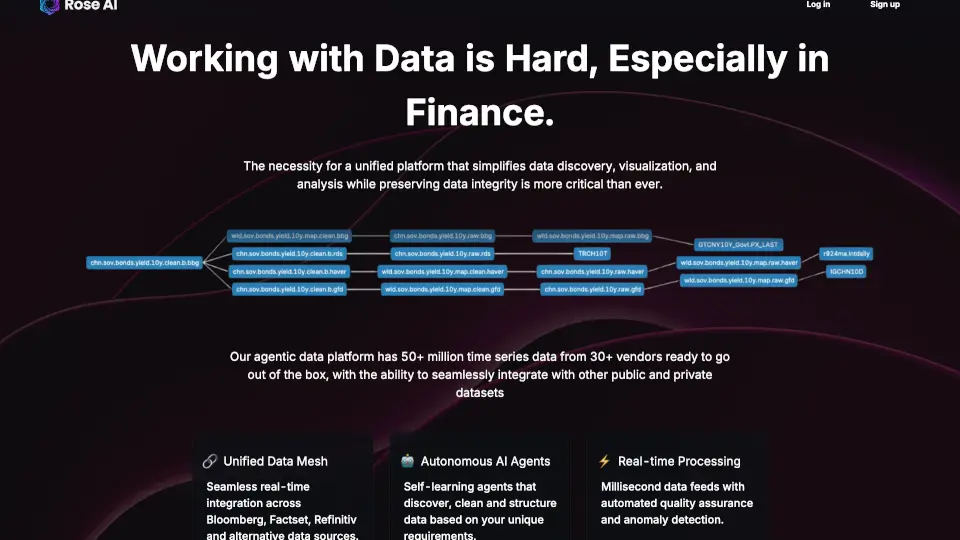
Rose AI is your all-in-one platform for data discovery, visualization, and analysis, designed to save time, foster collaboration, and turn data into actionable insights.
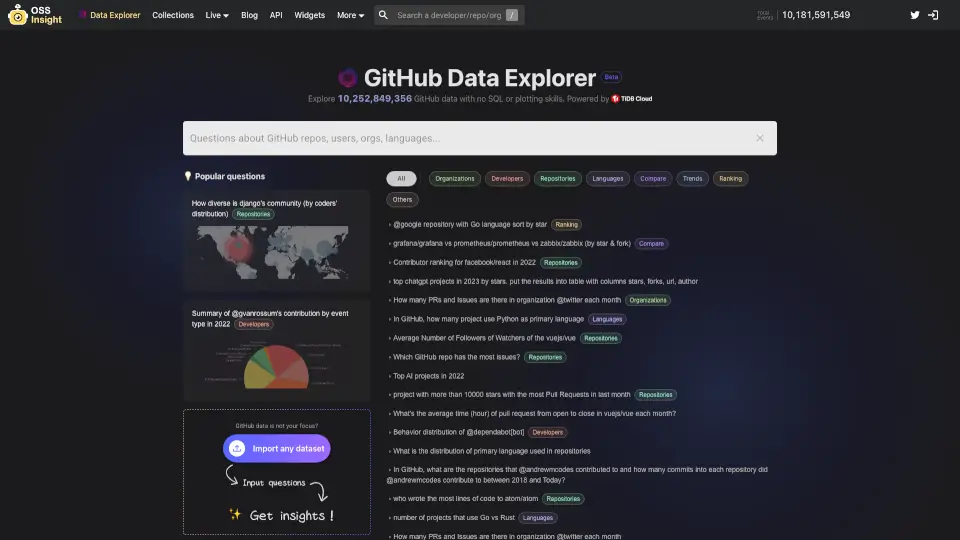
GitHub Data Explorer is an AI-powered tool that lets you explore GitHub event data effortlessly. No SQL skills needed—just ask questions and get insights.
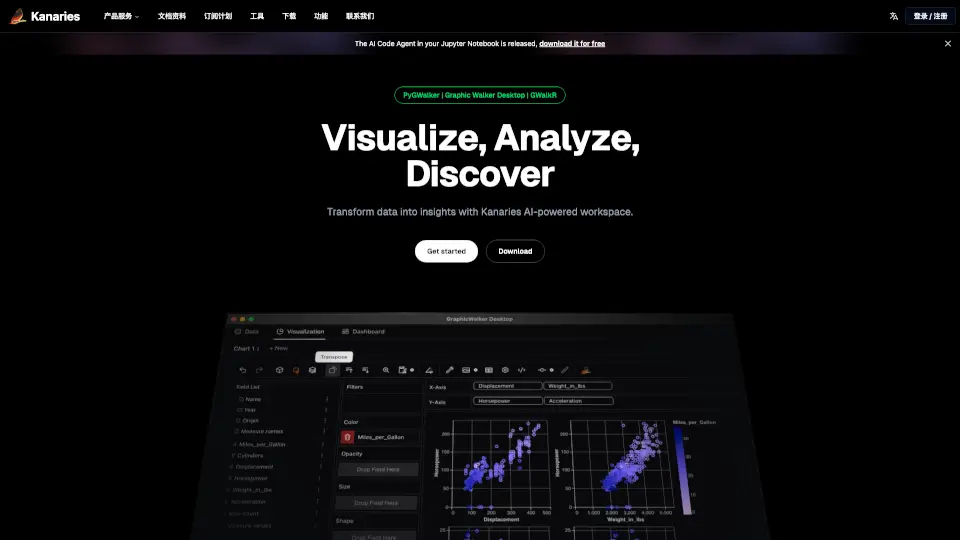
Kanaries is an AI-powered platform that simplifies data analysis, making it accessible for everyone. From exploration to collaboration, it’s your all-in-one tool for data insights.
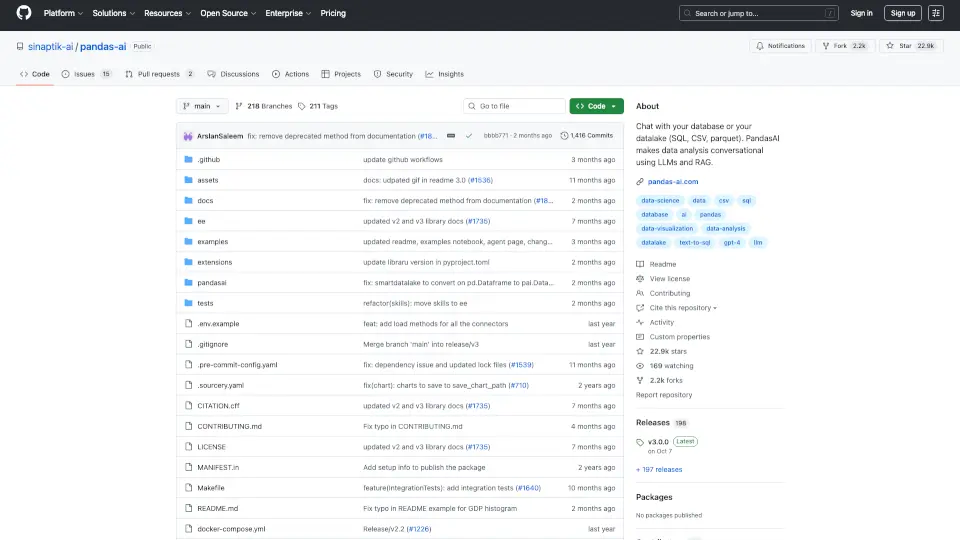
PandasAI makes data analysis conversational and accessible for everyone. Whether you’re querying databases or visualizing data, it’s the ultimate tool for natural language data interaction.
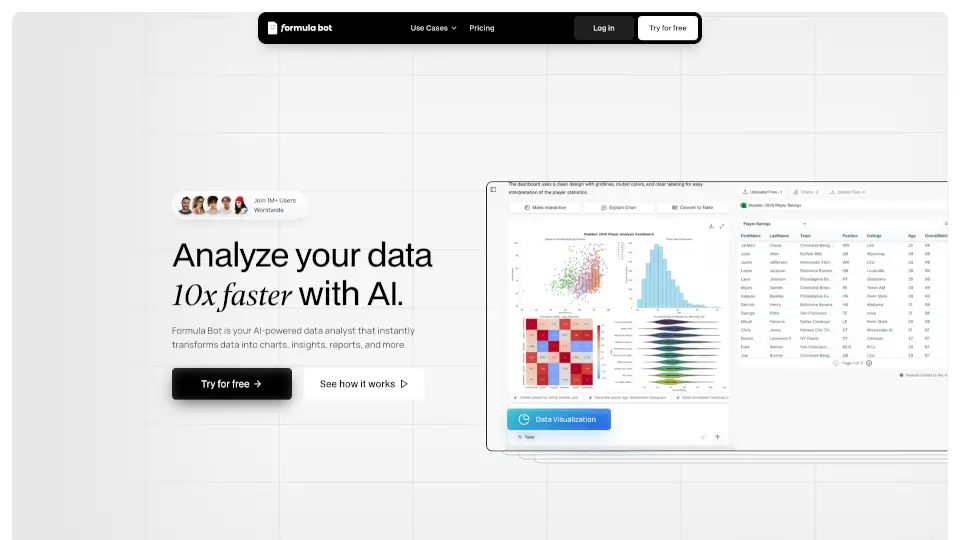
AI for Data Analysis - Formula Bot is the ultimate tool for anyone looking to simplify data analysis. With features like data connection, visualization, and automation, it’s perfect for businesses, students, and professionals alike.
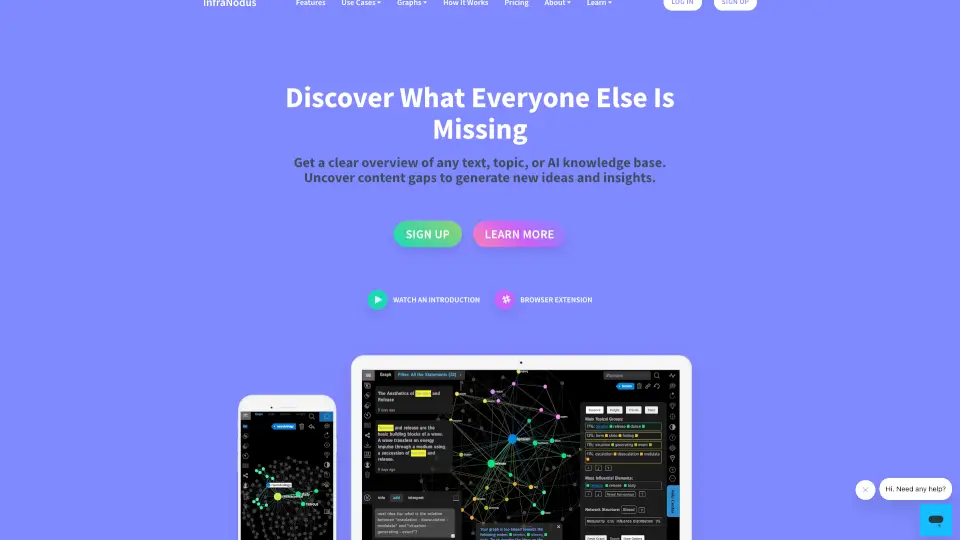
InfraNodus is a powerful AI tool that helps you visualize, analyze, and generate insights from any text or data. Perfect for research, brainstorming, and market analysis.
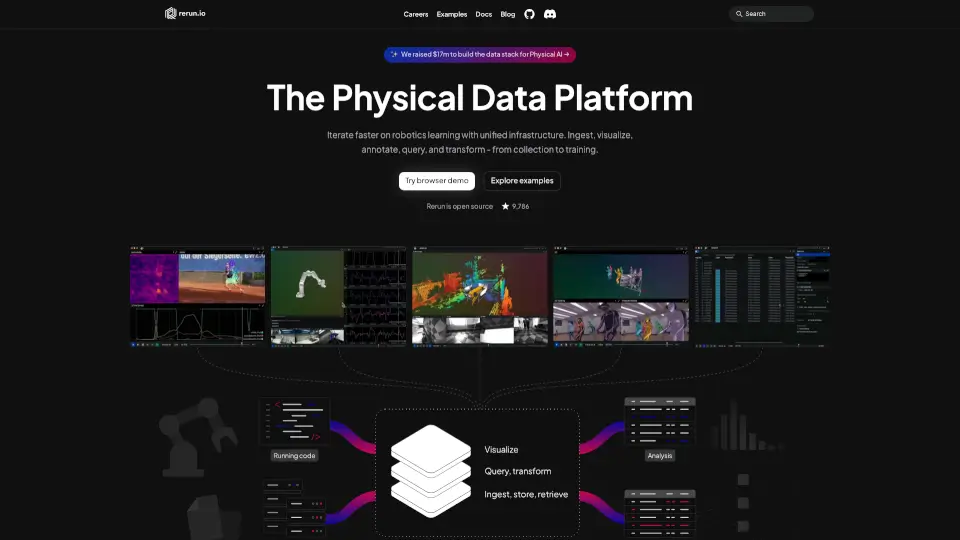
Rerun is an open-source, multimodal log handling and visualization tool designed for spatial and embodied AI. It’s fast, flexible, and easy to use, making it ideal for robotics, AI research, and 3D reconstruction.
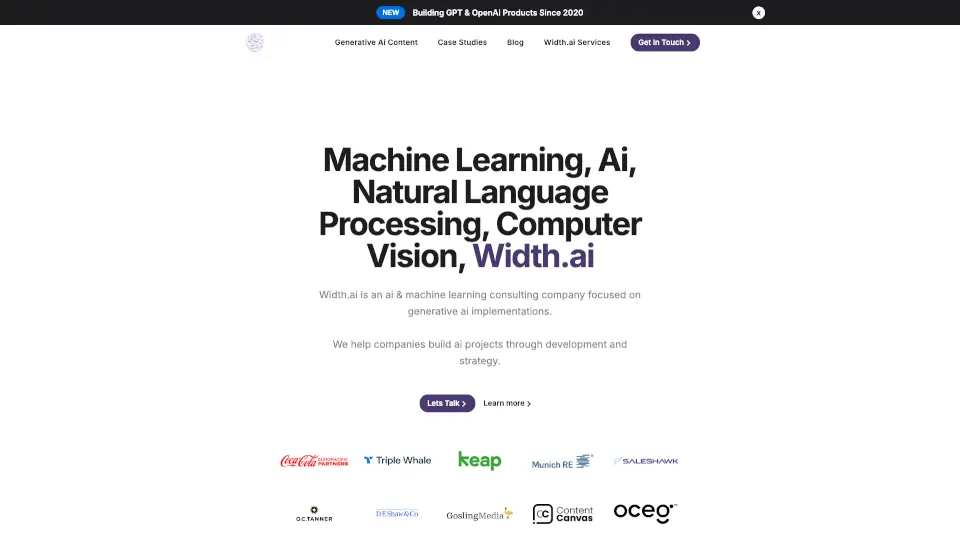
Width.ai offers AI and machine learning consulting services that help businesses automate workflows, boost revenue, and enhance product capabilities through cutting-edge technology.