
What is OpenObserve?
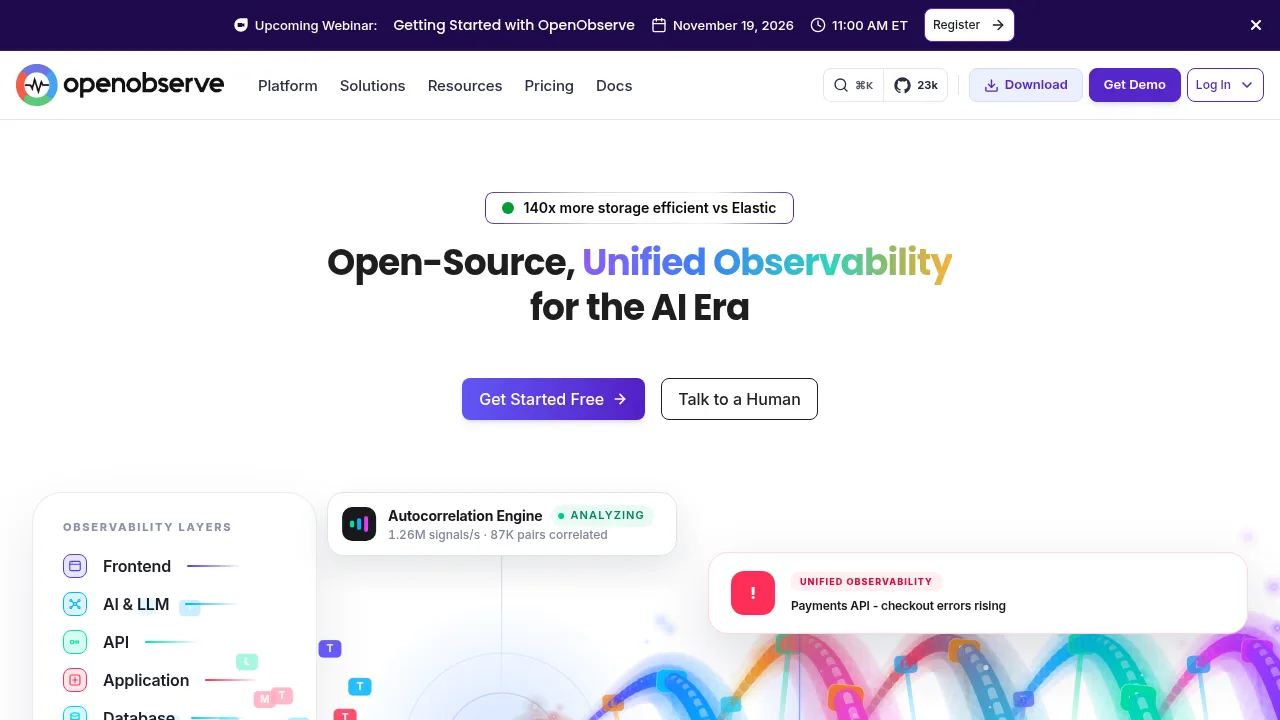
OpenObserve is an open-source observability platform that collects, stores, and correlates logs, metrics, and traces. It uses columnar Parquet storage built in Rust on the DataFusion engine to avoid indexing overhead. The platform is available as a self-hosted open-source project or through a managed cloud service.
What are the features of OpenObserve?
- Log searchIngests and queries log lines using SQL without requiring index construction.
- Distributed tracingFollows requests across services with trace context auto-correlated to logs and metrics.
- Metrics collectionStores and queries Prometheus-compatible metrics using the same engine as logs.
- LLM observabilityTraces prompts, completions, token usage, and cost across LLM applications.
- Automated incident triage (AI SRE)An agent that correlates root causes for incidents and drafts postmortems.
- AlertingConfigures real-time and scheduled alerts on telemetry data with routing to Slack, PagerDuty, and email.
What are the use cases of OpenObserve?
- Kubernetes cluster monitoringDeploys a collector via a single command to gather container logs, cluster events, metrics, and zero-code traces together.
- LLM application debuggingEvaluates prompt outputs against policy documents to identify failed completions and track token spend per model.
- Cross-cloud telemetry consolidationUnifies logs, metrics, and traces from AWS, GCP, and Azure environments using OpenTelemetry and StatsD collectors.
How to use OpenObserve?
- API workflow for Kubernetes setupRun the provided shell script with the cluster name, access key, and OpenObserve URL to automatically install cert-manager, the OTel operator, and the collector.
OpenObserve Pricing Information:
- Open sourceFree to download and self-host.
- Managed cloudOffers a free starting tier; specific paid plan prices and limits are not detailed in the source.