What is ChartPixel?
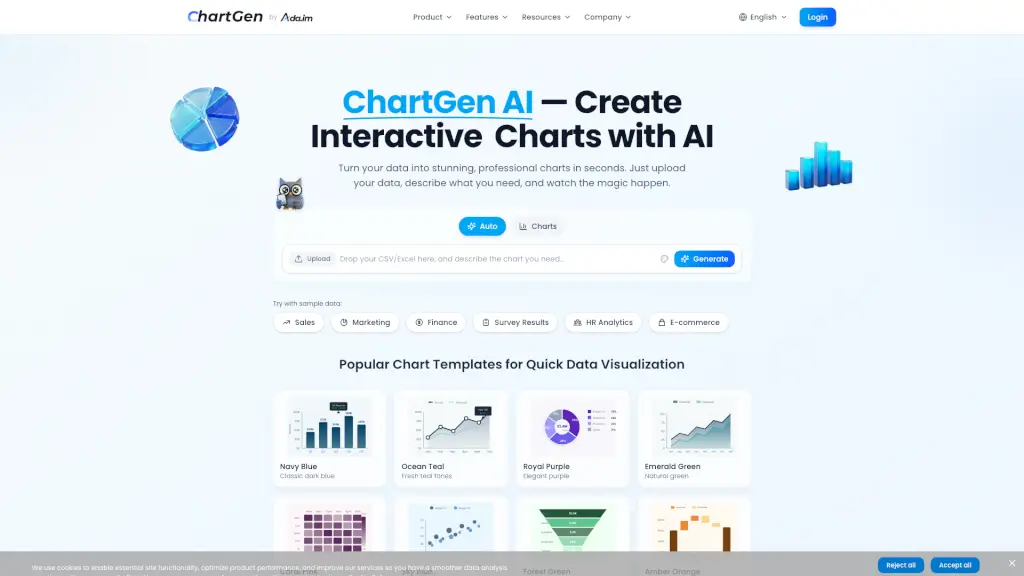
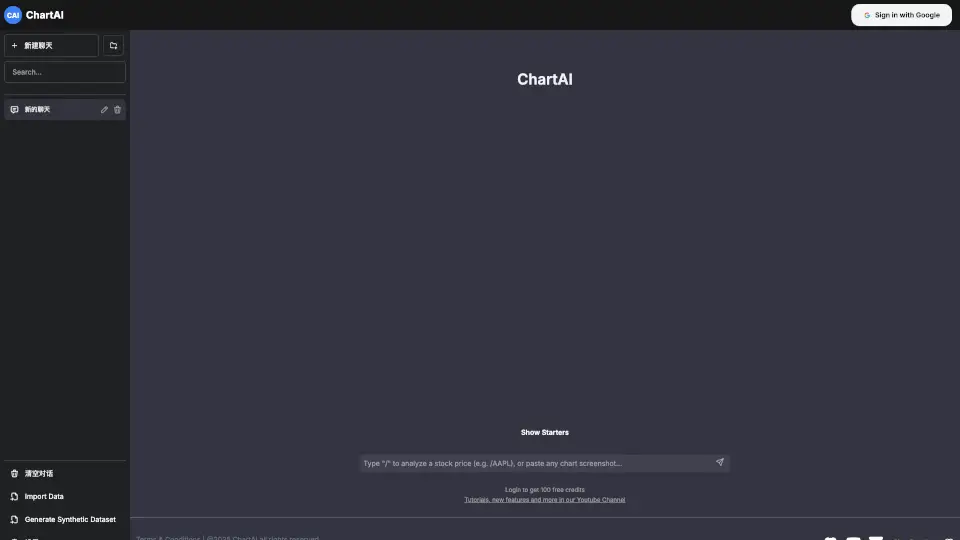
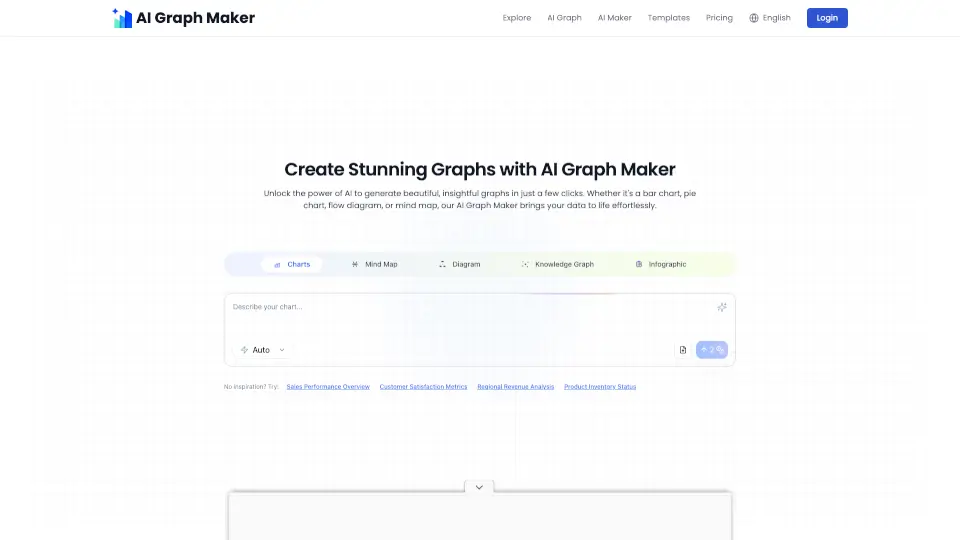
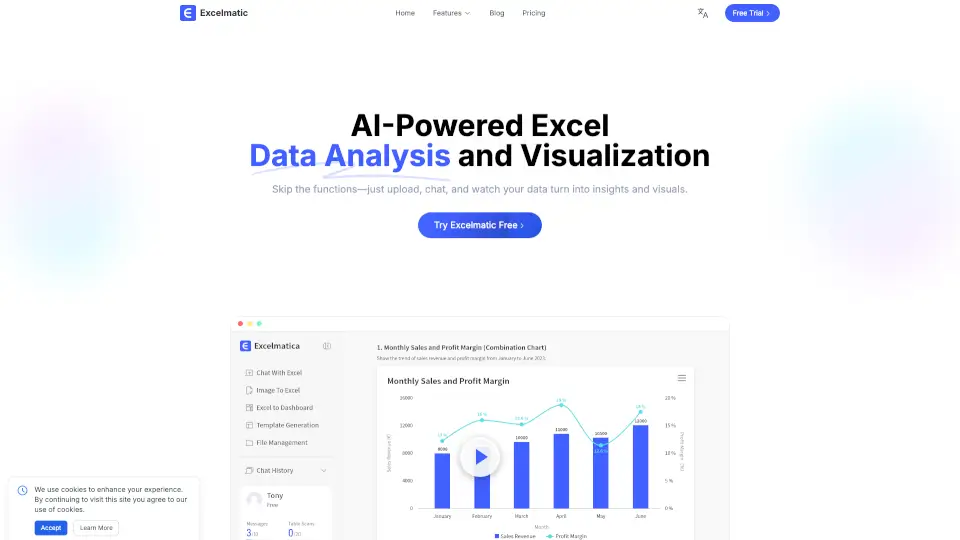
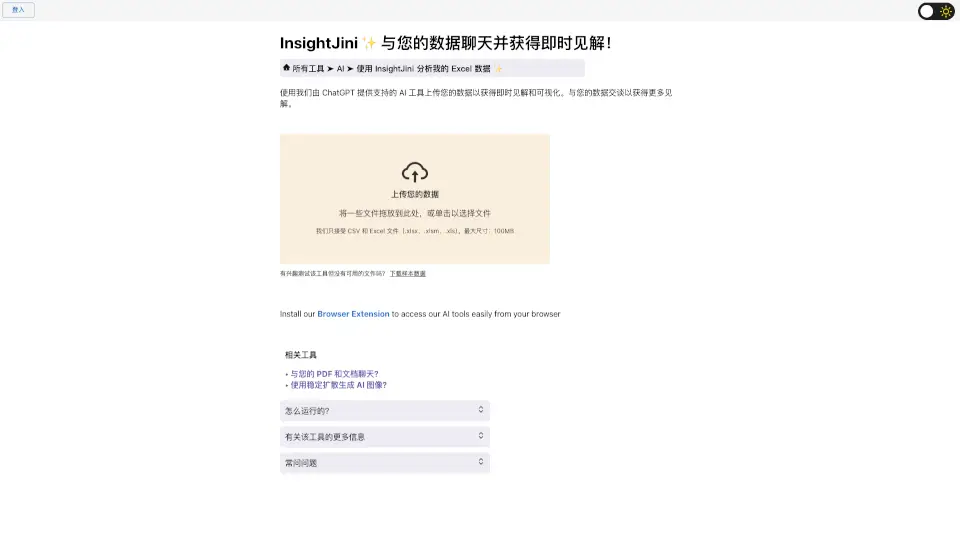
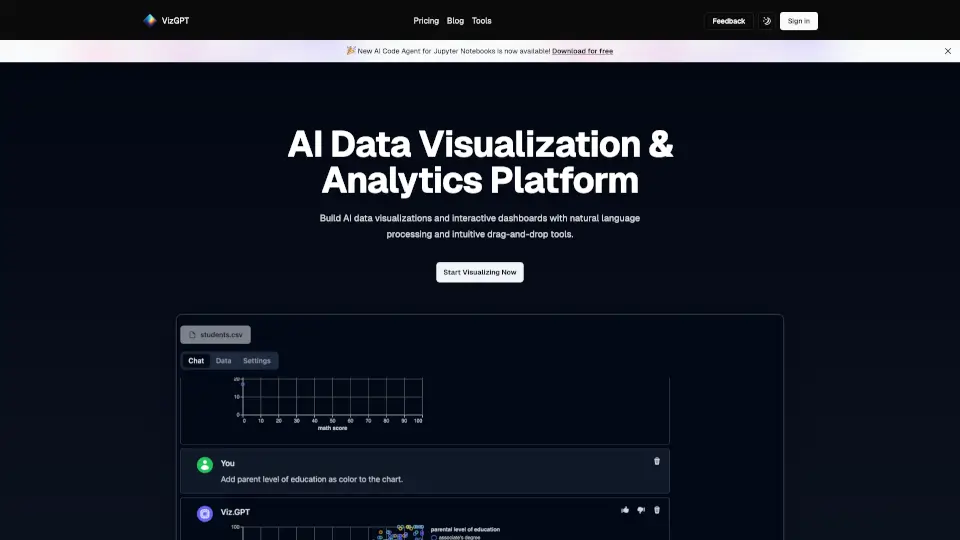
ChartPixel is your go-to tool for instant AI-driven data analysis. It transforms messy data into interactive charts and actionable insights without the hassle of complex software.
What are the features of ChartPixel?
- AI-Powered Analysis: Quickly analyze your data with the help of AI, making insights accessible to everyone.
- User-Friendly Interface: Designed for both beginners and pros, ChartPixel simplifies data visualization.
- Instant Charts: Generate beautiful charts in seconds, complete with explanations and insights.
- Data Cleaning: Automatically clean and format your data, saving you time and effort.
- Export Options: Easily export your charts and insights to PowerPoint for presentations.
What are the use cases of ChartPixel?
- Business Insights: Make informed decisions by visualizing your business data.
- Survey Analysis: Analyze customer feedback and sentiment effortlessly.
- Academic Research: Support your research with robust statistical analysis and visualizations.
- Personal Projects: Track personal data like sports stats or hobbies with ease.
How to use ChartPixel?
- Upload Your Data: Drag and drop your Excel or CSV files.
- Sit Back: Let ChartPixel tidy up your data automatically.
- Get Insights: Receive your charts and insights, ready to share or present.