ChartPixel vereinfacht die Datenanalyse mit interaktiven Diagrammen und AI-gestützten Einblicken.
Beste ChartPixel Alternativen & Wettbewerber 2026
Ein beliebtes AI-Charting-Tool mit 3.6K monatlichen Besuchen. Wir haben 20 ähnliche AI-Tools analysiert, um Ihnen beim Vergleich von Funktionen, Beliebtheit und Bewertungen zu helfen. Finden Sie die perfekte Alternative.
Schnellvergleich
(Top 5 nach Traffic)| Tool | Besuche | Hauptmarkt | Wachstum | Bewertung | Einblick | Beschreibung |
|---|---|---|---|---|---|---|
ChartPixelAktuell | 3.6K | 🇺🇸 United States36.2% | -2.0% | - | - | ChartPixel vereinfacht die Datenanalyse mit interaktiven Diagrammen und AI-gestützten Einblicken. |
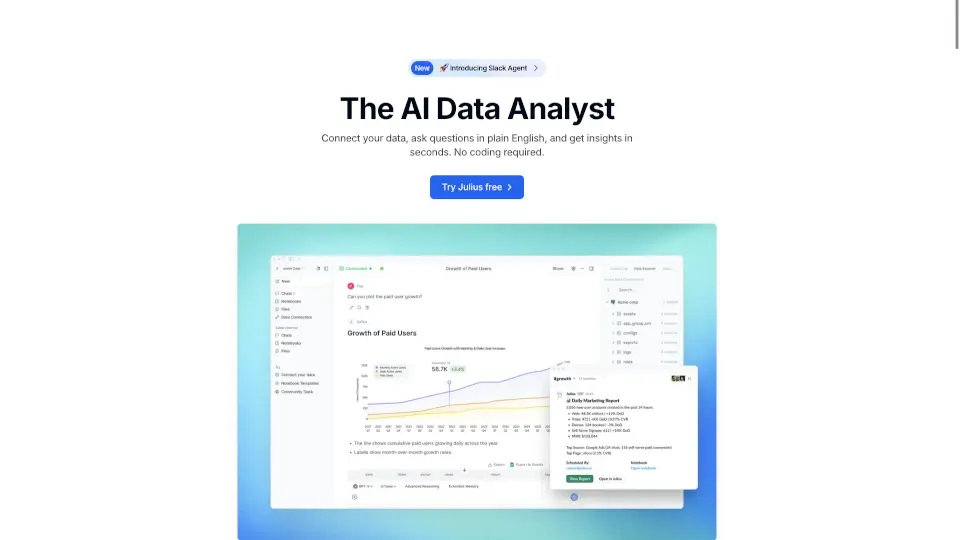
Julius AI | 633.5K | 🇮🇳 India22.9% | -27.4% | - | ⭐Mittlere Größe 100K-1M monatliche Besuche. Wachsendes Tool mit aktiver Entwicklung. | Q: Kann ich Julius für jede Art von Daten verwenden? A: Ja, Julius ist äußerst vielseitig und kann für geschäftliche, wissenschaftliche oder sogar Umfragedaten verwendet werden. Q: Ist Julius einfach zu bedienen? A: Absolut! Julius ist benutzerfreundlich und erfordert keine technischen Vorkenntnisse. Q: Gibt es eine kostenlose Version von Julius? A: Ja, du kannst Julius kostenlos ausprobieren und die meisten Funktionen nutzen. |
ChartGen AI | 146.7K | 🇮🇳 India7.7% | -1.1% | 5.0(1) | ⭐Mittlere Größe 100K-1M monatliche Besuche. Wachsendes Tool mit aktiver Entwicklung. | ChartGen AI verwandelt deine Daten in beeindruckende, professionelle Diagramme in Sekundenschnelle. Lade einfach deine Daten hoch, beschreibe, was du brauchst, und die KI erledigt den Rest. Keine Design- oder Programmierkenntnisse erforderlich. |
Graphy | 119.1K | 🇮🇳 India10.2% | -28.9% | - | ⭐Mittlere Größe 100K-1M monatliche Besuche. Wachsendes Tool mit aktiver Entwicklung. | Graphy ist das perfekte Tool, um professionelle Grafiken zu erstellen und Datenstorytelling auf die nächste Stufe zu heben. Es ist schnell, einfach zu bedienen und bietet atemberaubende Ergebnisse. |
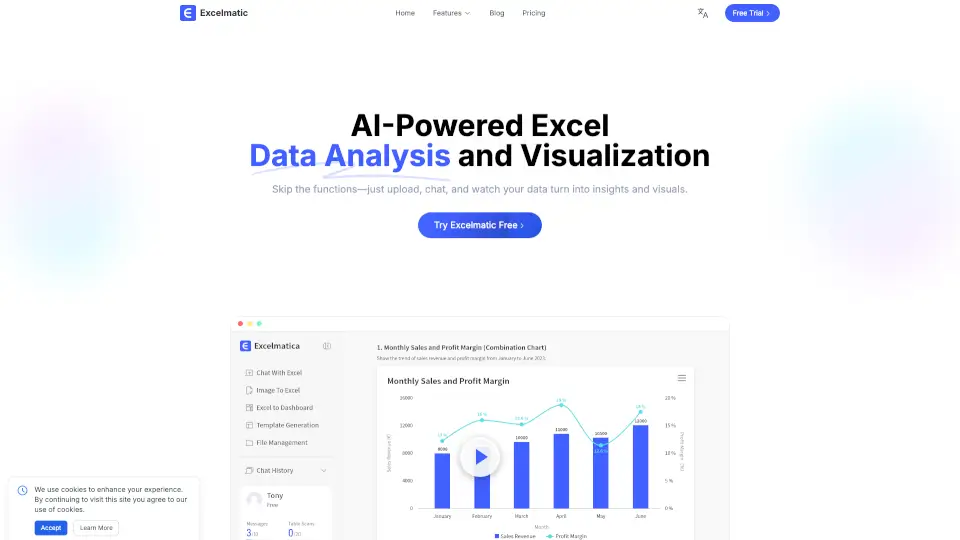
Excelmatic | 84.4K | 🇰🇷 Korea, Republic of7.5% | +34.2% | - | 📊Stetiges Wachstum Kürzliches Wachstum von 34%. Produkt in gesundem Aufwärtstrend. | Excelmatic macht Excel-Datenanalyse und Visualisierung einfach, schnell und verständlich – ganz ohne komplizierte Formeln oder stundenlange Arbeit. |
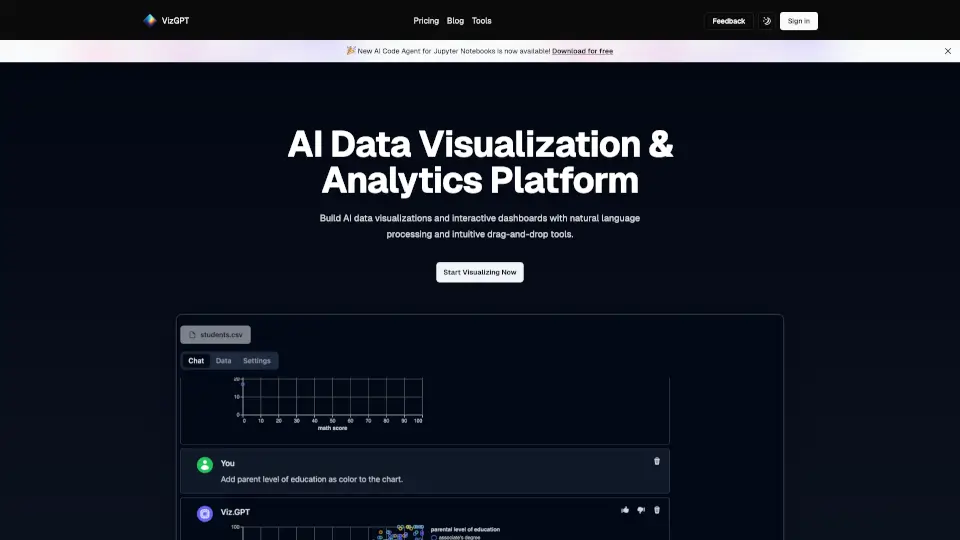
vizGPT | 61.4K | 🇮🇳 India20.4% | +34.6% | - | 📊Stetiges Wachstum Kürzliches Wachstum von 35%. Produkt in gesundem Aufwärtstrend. | VizGPT ist eine benutzerfreundliche AI-Plattform, die dir hilft, deine Daten in interaktive Diagramme und Dashboards zu verwandeln, indem du einfache Textanfragen stellst oder das intuitive Drag-and-Drop-Interface nutzt. |
Daten basierend auf Traffic-Metriken vom Juni 2026
Nächste Übereinstimmung
Tools, die ChartPixel funktional am nächsten kommen, sortiert nach semantischer Ähnlichkeit und Kategorie-Relevanz.
⭐Mittlere Größe
ChartGen AI verwandelt deine Daten in beeindruckende, professionelle Diagramme in Sekundenschnelle. Lade einfach deine Daten hoch, beschreibe, was du brauchst, und die KI erledigt den Rest. Keine Design- oder Programmierkenntnisse erforderlich.
146.7K
|5.0
🌱Aufstrebendes Tool
ChartAI macht Diagramme einfach: Mit ChatGPT-Hilfe erstellst du in Sekunden professionelle Visualisierungen – perfekt für Schule, Uni oder Job.
34.5K
|4.0

⭐Mittlere Größe
Graphy ist das perfekte Tool, um professionelle Grafiken zu erstellen und Datenstorytelling auf die nächste Stufe zu heben. Es ist schnell, einfach zu bedienen und bietet atemberaubende Ergebnisse.
119.1K
|5.0
📊Stetiges Wachstum
Erstellen Sie mit dem AI Graph Maker in Sekundenschnelle interaktive Diagramme für jedes Projekt – einfach, intelligent und visuell ansprechend.
30.0K
|4.0
Ähnliche Traffic-Größe
Alternativen mit vergleichbarem monatlichem Traffic wie ChartPixel, hilfreich für den Vergleich ähnlicher Marktphasen.

ChatCSV ist ein einfaches Tool, mit dem Sie Ihre CSV-Dateien befragen und analysieren können – perfekt für Anfänger und Experten.
4.2K
|3.0
Schnell wachsende Alternativen
Ähnliche Tools mit stärkerem jüngstem Traffic-Wachstum, um aufstrebende Alternativen zu erkennen.

🔥Explosives Wachstum
Entdecken Sie mit Seek AI, wie einfach Datenanalysen sein können!
19.5K
|4.0
🔥Explosives Wachstum
Quadratic ist ein AI-Spreadsheet, das Datenanalyse und Visualisierung vereinfacht.
178.3K
|5.0
📊Stetiges Wachstum
VizGPT ist eine benutzerfreundliche AI-Plattform, die dir hilft, deine Daten in interaktive Diagramme und Dashboards zu verwandeln, indem du einfache Textanfragen stellst oder das intuitive Drag-and-Drop-Interface nutzt.
61.4K
|5.0
📊Stetiges Wachstum
Excelmatic macht Excel-Datenanalyse und Visualisierung einfach, schnell und verständlich – ganz ohne komplizierte Formeln oder stundenlange Arbeit.
84.4K
|5.0
Top 20 Alternativen zu ChartPixel
Nach Ähnlichkeit sortiert⭐Mittlere Größe
ChartGen AI verwandelt deine Daten in beeindruckende, professionelle Diagramme in Sekundenschnelle. Lade einfach deine Daten hoch, beschreibe, was du brauchst, und die KI erledigt den Rest. Keine Design- oder Programmierkenntnisse erforderlich.
146.7K
|5.0
🌱Aufstrebendes Tool
ChartAI macht Diagramme einfach: Mit ChatGPT-Hilfe erstellst du in Sekunden professionelle Visualisierungen – perfekt für Schule, Uni oder Job.
34.5K
|4.0
⭐Mittlere Größe
Graphy ist das perfekte Tool, um professionelle Grafiken zu erstellen und Datenstorytelling auf die nächste Stufe zu heben. Es ist schnell, einfach zu bedienen und bietet atemberaubende Ergebnisse.
119.1K
|5.0
📊Stetiges Wachstum
Erstellen Sie mit dem AI Graph Maker in Sekundenschnelle interaktive Diagramme für jedes Projekt – einfach, intelligent und visuell ansprechend.
30.0K
|4.0
📊Stetiges Wachstum
Excelmatic macht Excel-Datenanalyse und Visualisierung einfach, schnell und verständlich – ganz ohne komplizierte Formeln oder stundenlange Arbeit.
84.4K
|5.0

⭐Mittlere Größe
InsightJini ermöglicht es Ihnen, per Chat mit Ihrer Datenanalyse zu interagieren, ohne Programmierkenntnisse – einfach hochladen, Fragen stellen und sofortige Antworten erhalten.
122.0K
|5.0
📊Stetiges Wachstum
VizGPT ist eine benutzerfreundliche AI-Plattform, die dir hilft, deine Daten in interaktive Diagramme und Dashboards zu verwandeln, indem du einfache Textanfragen stellst oder das intuitive Drag-and-Drop-Interface nutzt.
61.4K
|5.0

🌱Aufstrebendes Tool
TalktoData AI macht Datenanalyse kinderleicht – frag einfach los und erhalte sofort klare Antworten mit professionellen Visualisierungen. Perfekt für Unternehmen, Forscher und Neugierige!
12.3K
|4.0
⭐Mittlere Größe
Q: Kann ich Julius für jede Art von Daten verwenden? A: Ja, Julius ist äußerst vielseitig und kann für geschäftliche, wissenschaftliche oder sogar Umfragedaten verwendet werden. Q: Ist Julius einfach zu bedienen? A: Absolut! Julius ist benutzerfreundlich und erfordert keine technischen Vorkenntnisse. Q: Gibt es eine kostenlose Version von Julius? A: Ja, du kannst Julius kostenlos ausprobieren und die meisten Funktionen nutzen.
633.5K
|5.0
📉Traffic-Rückgang
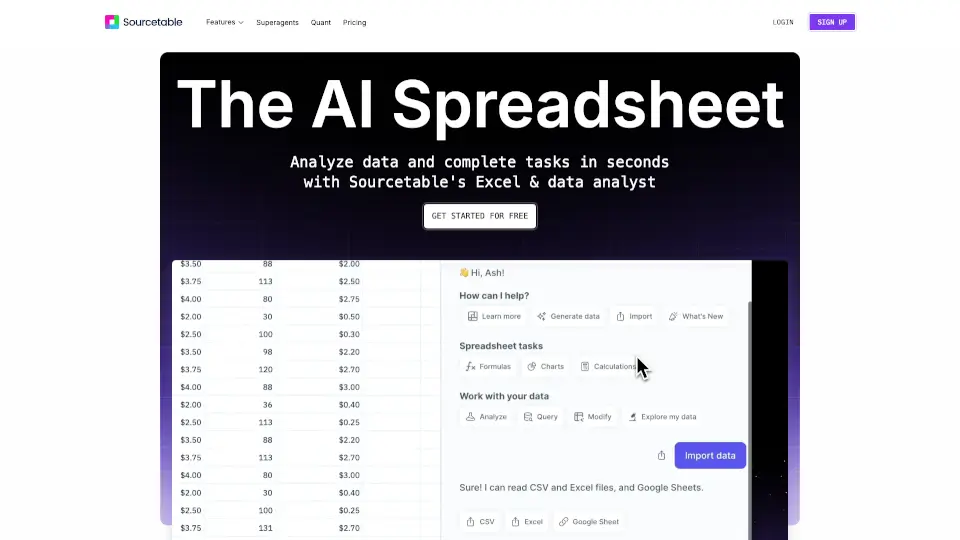
Sourcetable ist das ultimative KI-Tool für Tabellenkalkulationen, das dir dabei hilft, Daten schneller und effizienter zu analysieren, zu visualisieren und zu bereinigen.
27.9K
|4.0
ChatCSV ist ein einfaches Tool, mit dem Sie Ihre CSV-Dateien befragen und analysieren können – perfekt für Anfänger und Experten.
4.2K
|3.0

🌱Aufstrebendes Tool
PandaAI verwandelt Ihre Fragen in wertvolle Datenanalysen und Dashboards, die einfach zu bedienen sind.
21.1K
|4.0

🌱Aufstrebendes Tool
skills.ai revolutioniert die Datenanalyse mit KI-gestützten Tools für Berichte, Präsentationen und Infografiken – ganz ohne Programmierkenntnisse.
15.7K
|4.0

📉Traffic-Rückgang
PicDoc verwandelt Text per KI in sekundenschnelle, professionelle Infografiken und Diagramme – ideal für alle, die Ideen visuell und wirkungsvoll kommunizieren möchten.
40.1K
|4.0
📊Stetiges Wachstum
AI for Data Analysis - Formula Bot ist die ultimative KI-gestützte Plattform für die Datenanalyse. Mit über 900.000 Nutzern weltweit macht es die Datenanalyse einfacher, schneller und intelligenter.
405.4K
|5.0
🔥Explosives Wachstum
Quadratic ist ein AI-Spreadsheet, das Datenanalyse und Visualisierung vereinfacht.
178.3K
|5.0
⭐Mittlere Größe
Rows AI kombiniert die Flexibilität von Tabellenkalkulationen mit der Kraft von KI, um Datenanalyse und -transformation zu vereinfachen. Perfekt für Teams, die schnelle und präzise Einblicke in ihre Daten benötigen.
254.3K
|5.0
🌱Aufstrebendes Tool
Basedash ist eine benutzerfreundliche Plattform zur Erstellung von Dashboards und Diagrammen mit natürlicher Sprache.
50.5K
|5.0
⭐Mittlere Größe
Kanaries ist eine KI-gestützte Plattform, die dir hilft, Daten einfach zu visualisieren, zu analysieren und zu teilen.
146.9K
|5.0
🚀Sehr hoher Traffic
PandasAI revolutioniert die Datenanalyse durch natürliche Sprachverarbeitung und unterstützt verschiedene Datenformate. Es ist ideal für technische und nicht-technische Benutzer.
615.2M
|5.0
Häufig gestellte Fragen
Wie wir Alternativen zu ChartPixel finden und bewerten
Semantischer AlgorithmusPowered by SimilarWebKeine bezahlten Platzierungen
Wir erstellen für jedes KI-Tool in unserer Datenbank einen semantischen Vektor (Embedding). Alternativen werden gefunden, indem zunächst Kandidaten auf Tools derselben Kategorien eingeschränkt werden, dann nach Kosinus-Ähnlichkeitswert gerankt. Nur Tools mit einem Ähnlichkeitswert ≥ 0,52 werden aufgenommen – jede Empfehlung ist wirklich relevant und nicht nur wegen einer breiten Kategorie gelistet.
Die vollständige Liste (bis zu 20 Tools) ist nach semantischer Ähnlichkeit geordnet. Der «Schnellvergleich» geht einen Schritt weiter: Er nimmt die Top-Kandidaten und rankt sie nach monatlichem Traffic neu, um Ihnen einen schnellen Überblick über die meistgenutzten Optionen zu geben.
Der Schnellvergleich hat weniger Plätze und einen zusätzlichen Traffic-Schwellenwert. Ein Tool kann sehr ähnlich sein, aber weniger monatlichen Traffic haben als andere Kandidaten – es bleibt in der vollständigen Liste, wo Sie es noch entdecken und bewerten können.
Monatliche Besucherzahlen, Wachstumsraten und regionale Verteilungsdaten stammen von SimilarWeb über unsere lizenzierte API. SimilarWeb ist der Industriestandard für Web-Analysen, der von Analysten, Investoren und Produktteams weltweit genutzt wird. Der Datenmonat wird am unteren Rand der Schnellvergleichstabelle angezeigt.
Ähnlichkeitsbeziehungen werden regelmäßig neu berechnet, wenn neue Tools hinzugefügt werden. Traffic-Metriken werden monatlich von SimilarWeb aktualisiert. Der genaue Datenmonat ist immer am unteren Rand der Schnellvergleichstabelle sichtbar, damit Sie die Aktualität der Daten einschätzen können.
Nein. Die Reihenfolge der Ergebnisse wird vollständig durch unseren Ähnlichkeitsalgorithmus und Drittanbieter-Verkehrsdaten bestimmt. Wir verkaufen keine Platzierungen in Alternativenlisten oder Schnellvergleichstabellen. Wenn ein Tool hier gelistet ist, hat es seinen Platz durch Daten verdient – nicht durch Werbeausgaben.
Verkehrsdaten (Besuche, Wachstum, Top-Markt) von SimilarWeb lizenzierter API · Ähnlichkeitswerte von unserer eigenen Vektorsuchmaschine