

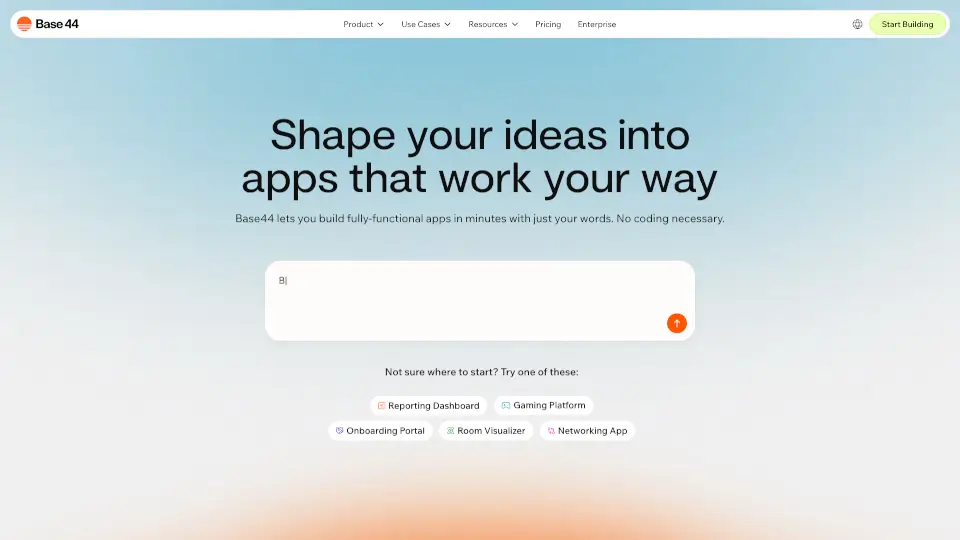
Basedash simplifies data visualization with AI, allowing users to create dashboards and charts effortlessly.
Best Basedash Alternatives & Competitors 2026
A popular AI Analytics Assistant tool with 43.4K monthly visits. We've analyzed 20 similar AI tools to help you compare features, popularity, and ratings. Find the perfect alternative for your needs.
Quick Comparison
(Top 5 by Traffic)| Tool | Visits | Top Market | Growth | Rating | Insight | Description |
|---|---|---|---|---|---|---|
 BasedashCurrent | 43.4K | 🇺🇸 United States27.9% | -21.8% | - | 📉Traffic Decline Significant traffic drop recently. Check for alternatives. | Basedash simplifies data visualization with AI, allowing users to create dashboards and charts effortlessly. |
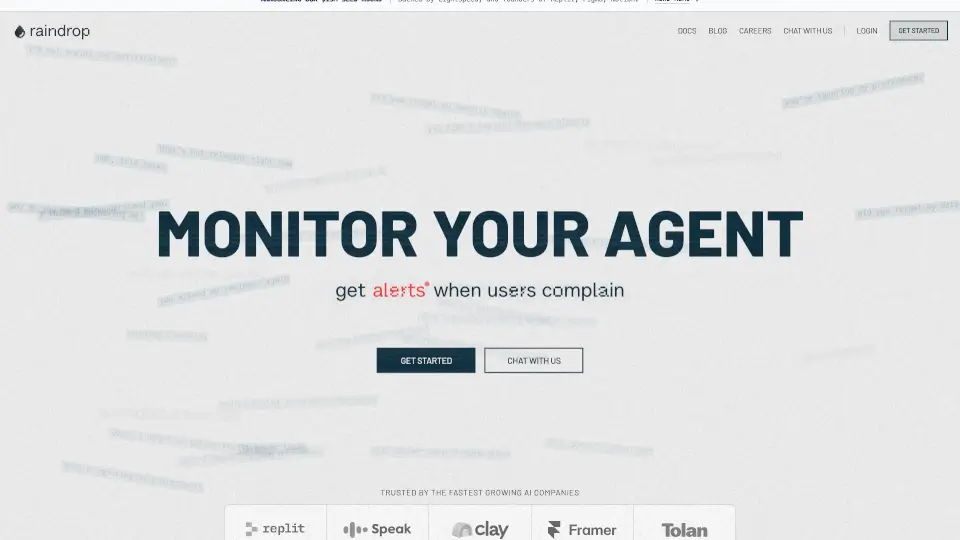
 ChartGen AI | 147.9K | 🇮🇳 India6.5% | -5.3% | 5.0(1) | ⭐Medium Scale 100K-1M monthly visits. Growing tool with active development. | ChartGen AI is a free, AI-powered chart generator that turns your data into professional, customizable charts in seconds, making data visualization easy and accessible for everyone. |
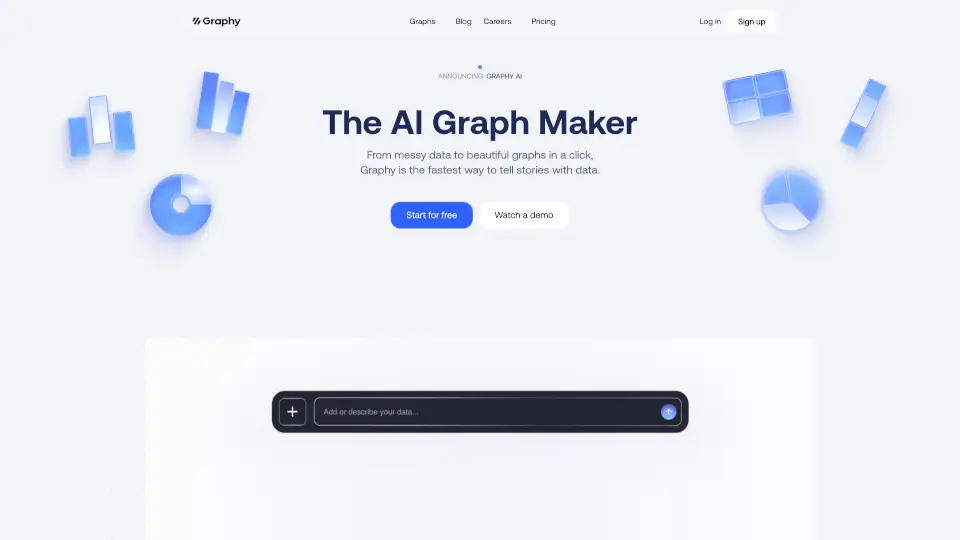
 Graphy | 107.8K | 🇮🇳 India15.1% | -11.1% | - | ⭐Medium Scale 100K-1M monthly visits. Growing tool with active development. | Graphy is the ultimate tool for creating beautiful, actionable graphs in seconds. With AI-powered insights and a user-friendly interface, it’s perfect for teams, businesses, and content creators. |
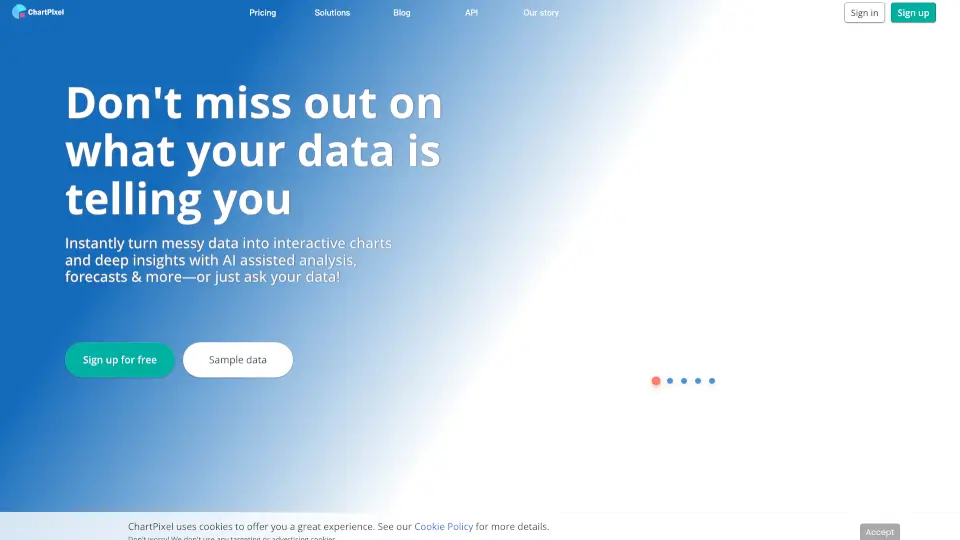
 Chat2DB | 77.1K | 🇺🇸 United States7.0% | -15.3% | - | 🌱Emerging Tool 10K-100K monthly visits. Niche or new tool with potential unique value. | Chat2DB is an AI-powered database tool that makes data management easy. It supports natural language queries, multi-database management, and secure data handling. Perfect for data analysts, developers, and business users. |
 vizGPT | 58.0K | 🇺🇸 United States18.3% | +3.4% | - | 🌱Emerging Tool 10K-100K monthly visits. Niche or new tool with potential unique value. | vizGPT turns your data into interactive charts and analytics dashboards using natural language and drag-and-drop tools, making data analysis easy and fast. |
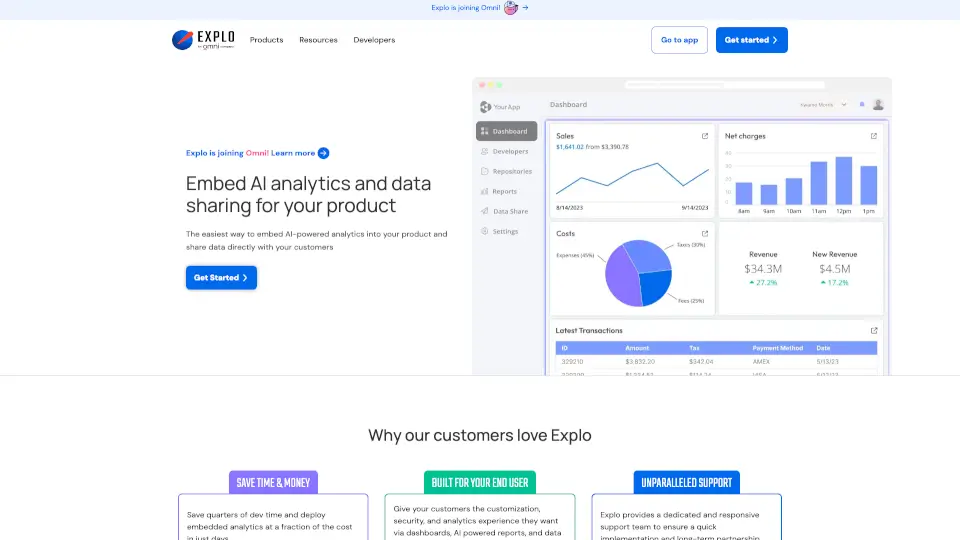
 AskYourDatabase | 11.2K | 🇺🇸 United States19.6% | +21.1% | - | 📊Steady Growth Recent growth of 21%. Product is in a healthy upward trend. | AskYourDatabase SQL AI is a game-changer for data interaction, offering accuracy, security, and ease of use for both technical and non-technical users. |
Data based on traffic metrics from August 2026
Closest Match
Tools that are functionally closest to Basedash, ranked by semantic similarity and category relevance.






Similar Traffic Scale
Alternatives with comparable monthly traffic to Basedash, useful for comparing peers at a similar market stage.
Fast Growing Alternatives
Similar tools with stronger recent traffic growth, highlighting alternatives that may be gaining momentum.
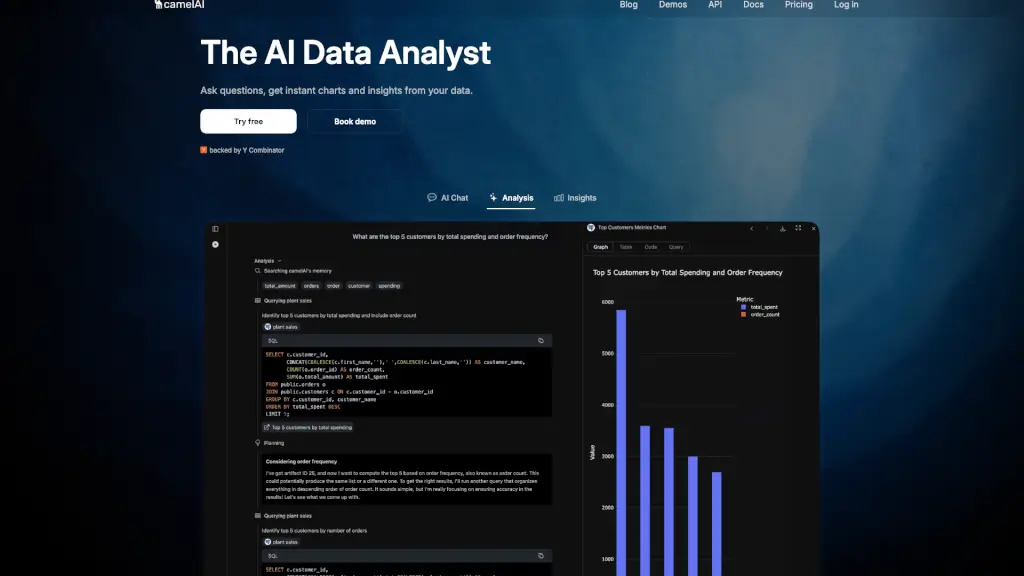

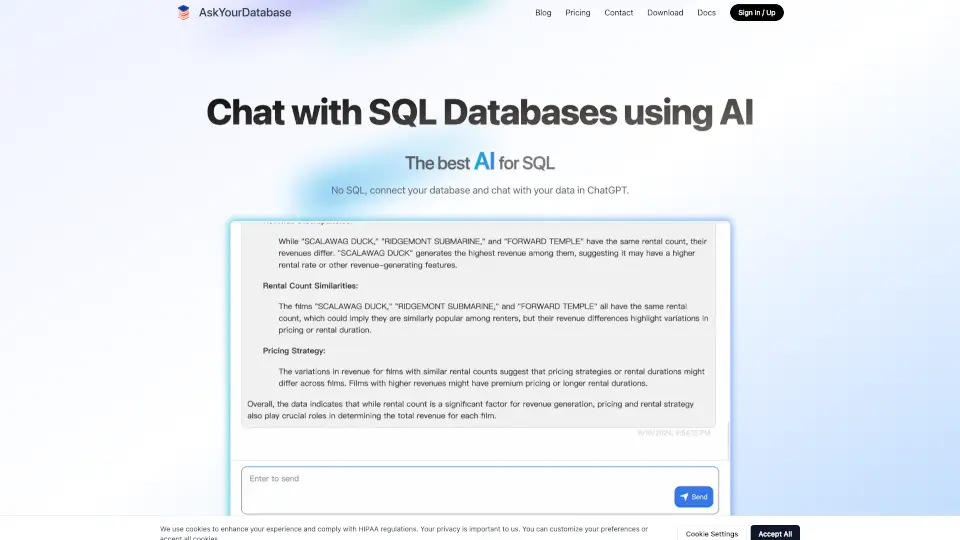
Top 20 Alternatives to Basedash
Sorted by Similarity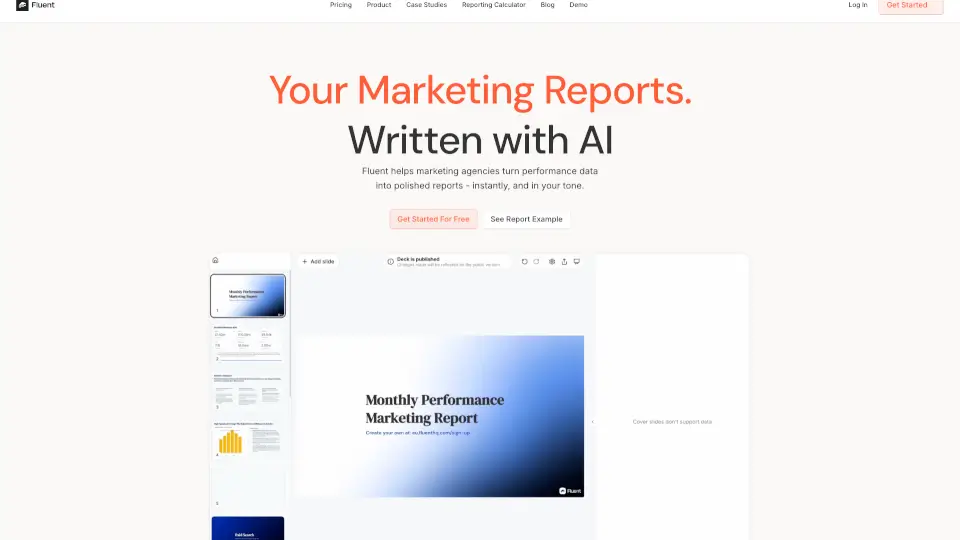


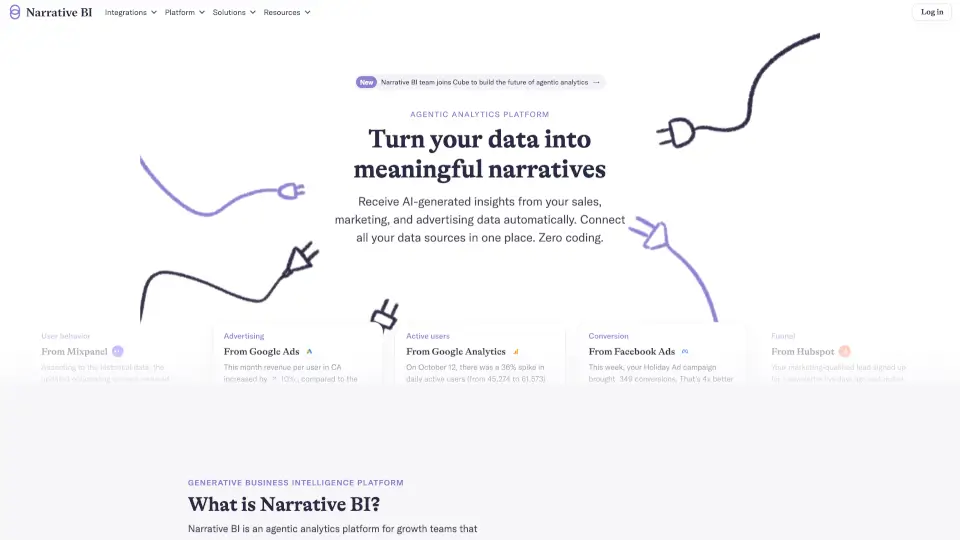

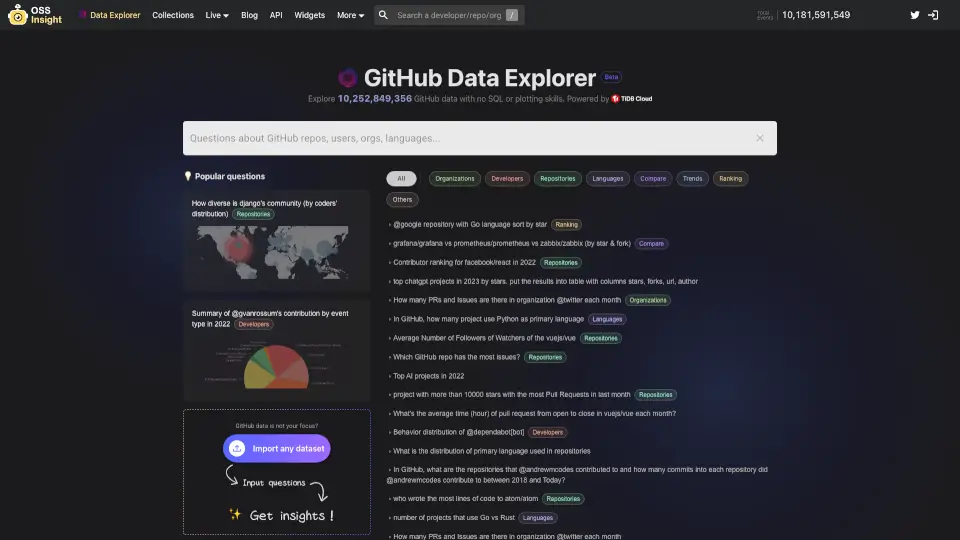

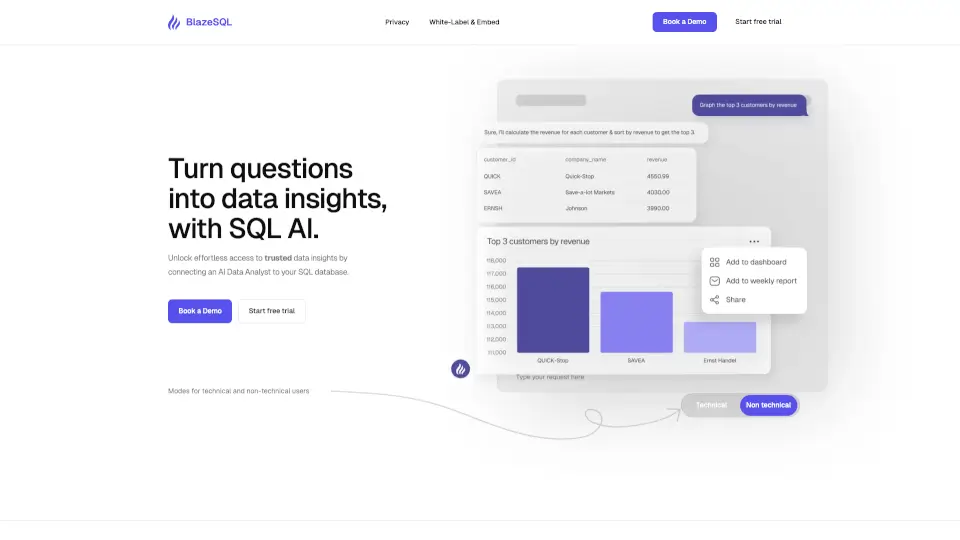

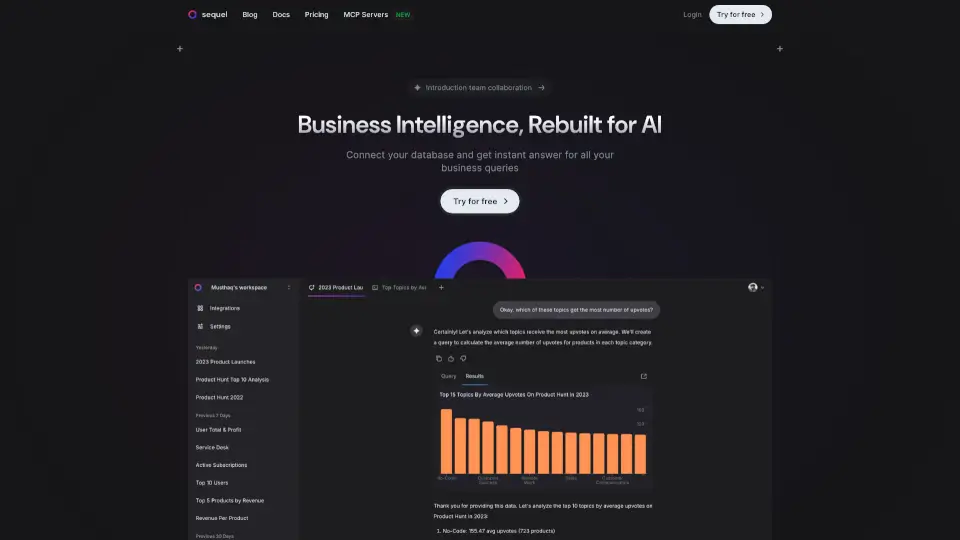

Frequently Asked Questions
How we find and rank alternatives to Basedash
Semantic AlgorithmPowered by SimilarWebNo Paid Placements
We generate a semantic embedding (vector) for every AI tool in our database. Alternatives are found by first narrowing candidates to tools in the same categories, then ranking by cosine similarity score. Only tools with a similarity score ≥ 0.52 make the cut — ensuring every recommendation is genuinely related, not just popular in the same broad category.
The full list (up to 20 tools) is ordered by semantic similarity — the most functionally similar tools appear first. "Quick Comparison" goes one step further: it takes the top candidates from that list and re-ranks them by monthly traffic, giving you a fast snapshot of the most widely-used options right now.
Quick Comparison has fewer slots and adds a traffic threshold on top of similarity. A tool can be highly similar to the one you are looking at but still have lower monthly traffic than other candidates — it stays in the full list where you can still discover and evaluate it.
Monthly visits, growth rates, and regional distribution data are sourced from SimilarWeb via our licensed API. SimilarWeb is the industry-standard web analytics service used by analysts, investors, and product teams worldwide. The data month is displayed at the bottom of the Quick Comparison table.
Similarity relationships are recalculated periodically as new tools are added to our database. Traffic metrics (visits, growth rate, top market) are refreshed monthly from SimilarWeb. The exact data month is always shown at the bottom of the Quick Comparison table so you know how fresh the numbers are.
No. The order of results is determined entirely by our similarity algorithm and third-party traffic data. We do not sell placement positions in alternative lists or Quick Comparison tables. If a tool is listed here, it earned its place through data — not through advertising spend.
Traffic data (visits, growth, top market) sourced from SimilarWeb licensed API · Similarity scores computed by our in-house vector engine