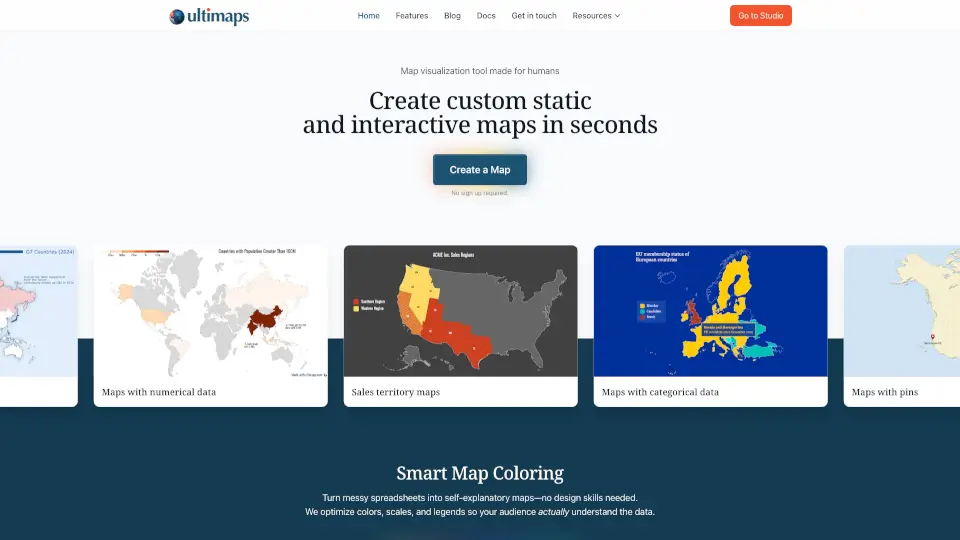
What is Ultimaps?
Ultimaps is your go-to tool for creating stunning, interactive maps and charts in seconds. No design skills? No problem. Just upload your data or describe what you need in plain English, and Ultimaps handles the rest—colors, scales, legends, even fixing messy data. Best part? No signup required.
What are the features of Ultimaps?
- Smart Map Coloring: Automatically picks the perfect color palette and scales for your data.
- Interactive Maps: Add tooltips, popups, and more—no coding needed.
- Multiple Export Options: Download as PNG, SVG, PDF, or embed directly on your website.
- AI-Powered Suggestions: Describe your map in a prompt, and Ultimaps generates it for you.
- Data Fixes: Recognizes messy or inconsistent data (like "NY" vs "New York") and cleans it up.
What are the use cases of Ultimaps?
- Sales Teams: Visualize territories or regional performance instantly.
- Educators: Create engaging maps for lessons or presentations.
- Marketers: Highlight geographic trends in campaigns or reports.
- Researchers: Turn spreadsheets into clear, visual insights.
How to use Ultimaps?
- Upload your data (Excel, CSV) or type a prompt (e.g., "Color states by population").
- Let Ultimaps analyze and design the map for you.
- Tweak colors, add pins, or annotations if needed.
- Download, share, or embed your map—done!