
Microsoft Power BI logo

Microsoft Power BI

Microsoft Power BI is a versatile business analytics tool that transforms raw data into meaningful insights through interactive visualizations, detailed reports, and real-time dashboards, empowering better decision-making.

Microsoft Power BI

Microsoft Power BI Product Information

What is Microsoft Power BI?

Microsoft Power BI is a powerful tool that helps you transform your data into meaningful insights. With its user-friendly interface and robust features, it allows you to create stunning visualizations, detailed reports, and interactive dashboards. Whether you're a business analyst, a data scientist, or just someone who wants to make sense of their data, Power BI makes it easy to uncover trends, patterns, and key metrics that can drive better decision-making.

What are the features of Microsoft Power BI?

  • Data Visualization
    Create beautiful and insightful charts, graphs, and maps to visualize your data.
  • Interactive Dashboards
    Build dynamic dashboards that update in real-time, allowing you to monitor your KPIs at a glance.
  • Data Integration
    Connect to a wide range of data sources, from Excel spreadsheets to cloud services, and bring all your data together in one place.
  • Collaboration
    Share your reports and dashboards with colleagues, and collaborate on projects in real-time.
  • Custom Reports
    Design custom reports tailored to your specific needs, with the ability to add filters, slicers, and more.
  • Mobile Access
    Access your dashboards and reports on the go with the Power BI mobile app, available for iOS and Android.

What are the use cases of Microsoft Power BI?

  • Business Intelligence
    Analyze sales data, customer behavior, and market trends to make informed business decisions.
  • Financial Reporting
    Generate financial reports and track budget performance with ease.
  • Project Management
    Monitor project progress, resource allocation, and timelines in real-time.
  • Marketing Analytics
    Track the effectiveness of marketing campaigns, analyze customer engagement, and optimize your strategies.
  • Operational Efficiency
    Identify bottlenecks and areas for improvement in your operations by visualizing key performance indicators.

How to use Microsoft Power BI?

  • Sign up for a Power BI account using your email address.
  • Connect to your data sources, such as Excel, SQL Server, or cloud services like Azure.
  • Create a new report by selecting the data you want to visualize.
  • Choose from a variety of visualization options, such as charts, tables, and maps, to represent your data.
  • Customize your dashboard by adding filters, slicers, and other interactive elements.
  • Share your reports and dashboards with team members or publish them to the web.
Do you like this tool?

Upvote to help others discover it!

Microsoft Power BI Alternatives

Tableau

Tableau

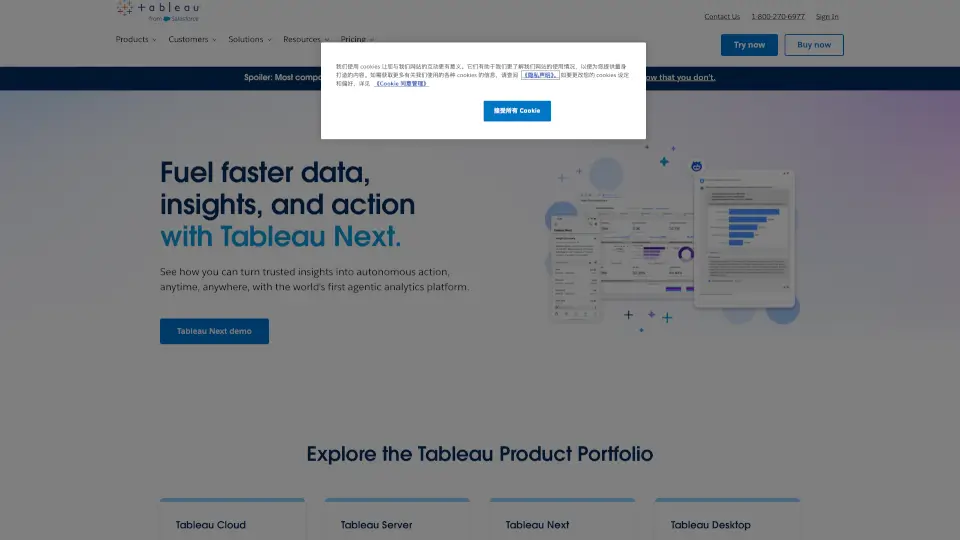
Tableau is a user-friendly business intelligence and analytics software that helps you connect to data, create visualizations, and share insights with ease, making data-driven decisions accessible to everyone.

US
40.91%
6.7M
0
Narrative BI

Narrative BI

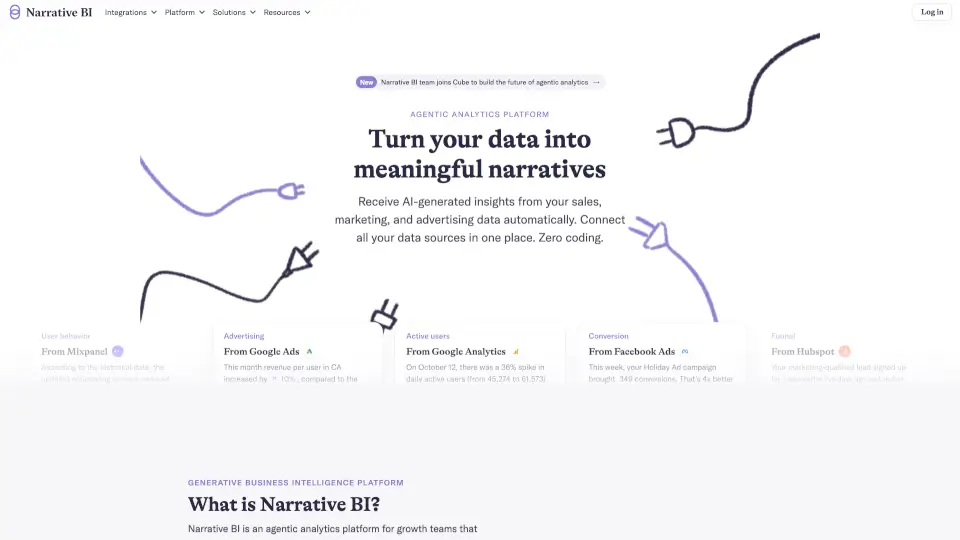
Narrative BI is an automated business intelligence platform that uses generative AI to turn raw marketing, sales, and advertising data into clear, actionable insights—no technical skills required.

53
0
vizGPT

vizGPT

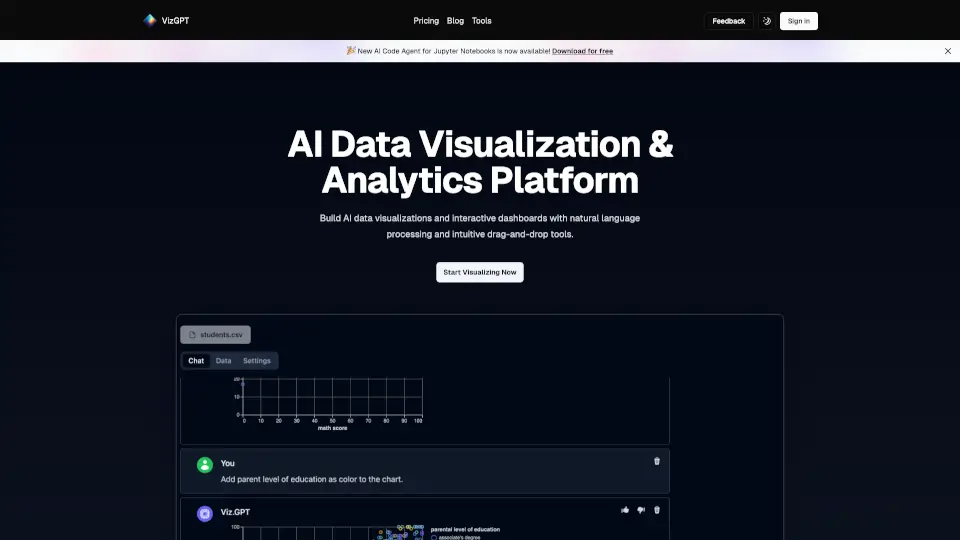
vizGPT turns your data into interactive charts and analytics dashboards using natural language and drag-and-drop tools, making data analysis easy and fast.

US
12.77%
62.1K
0
Bricks

Bricks

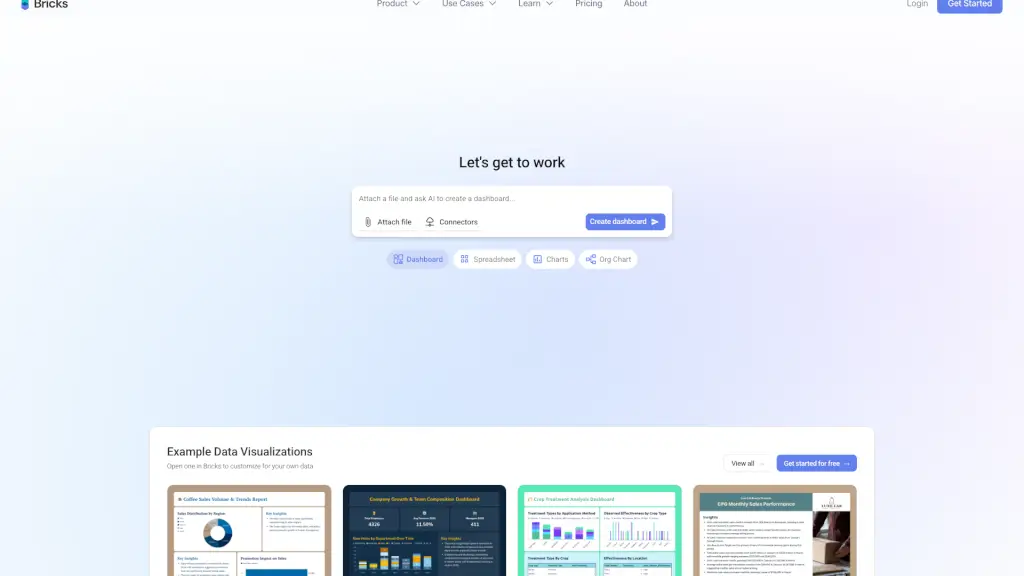
Bricks transforms CSV and Excel files into AI-generated dashboards, reports, and presentations in seconds—no expertise needed.

US
45.88%
250.6K
0
Pandas AI - Conversational Data Analysis

Pandas AI - Conversational Data Analysis

Pandas AI - Conversational Data Analysis lets users query connected databases and SaaS platforms using natural language to generate charts and dashboards.

US
20.63%
14.4K
0
Wren AI Cloud

Wren AI Cloud

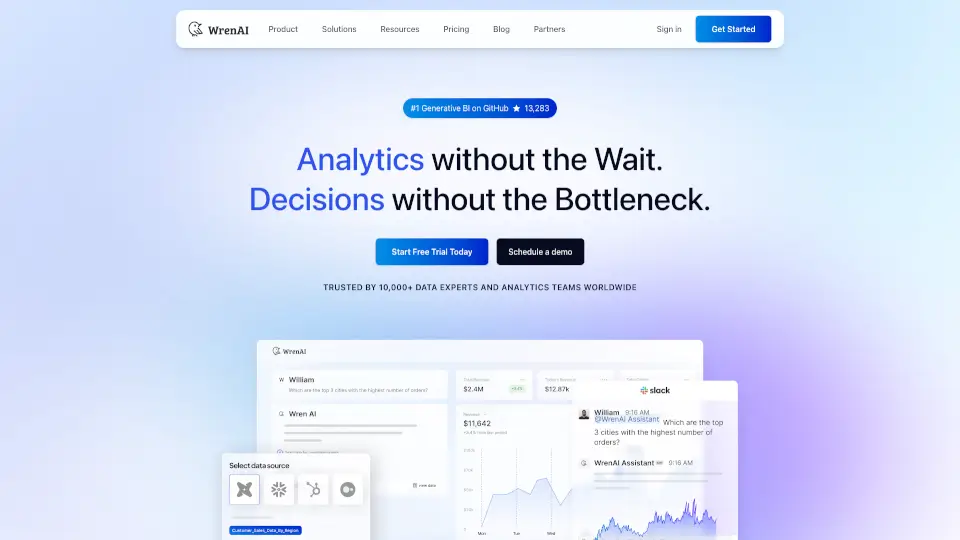
Wren AI Cloud makes data easy for everyone—ask, visualize, and act faster.

IN
19.55%
37.7K
0
PandasAI

PandasAI

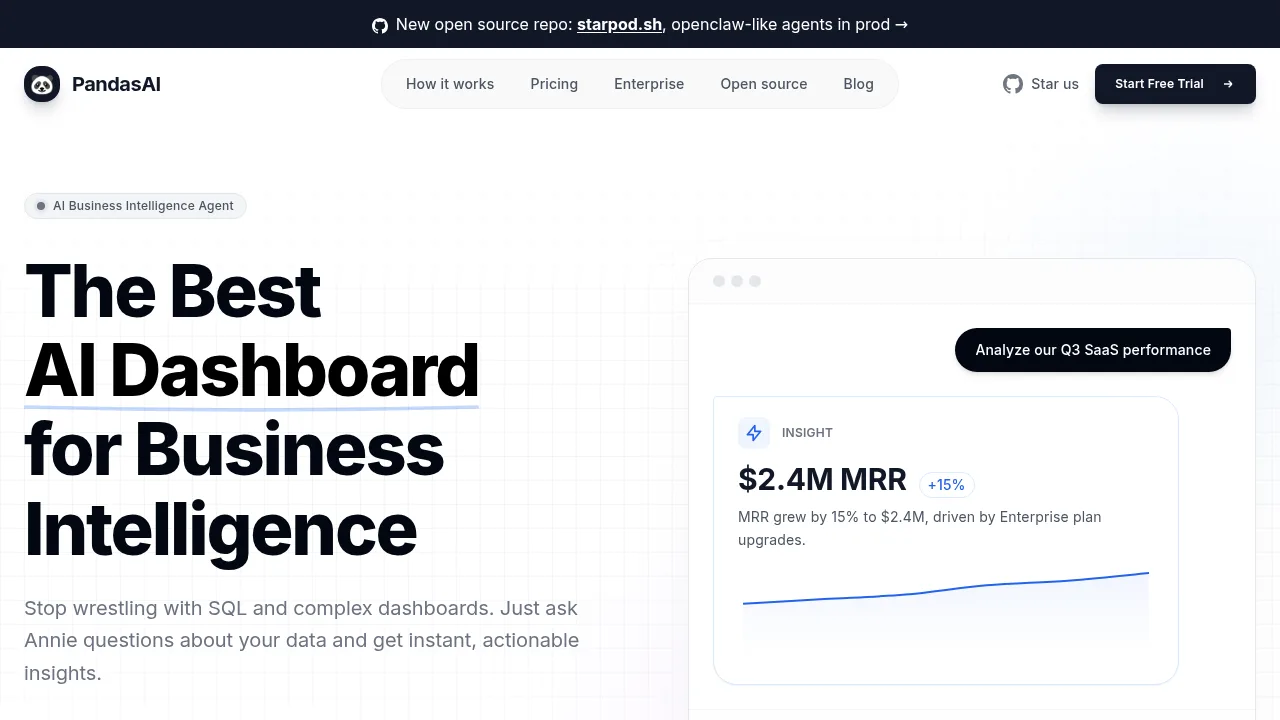
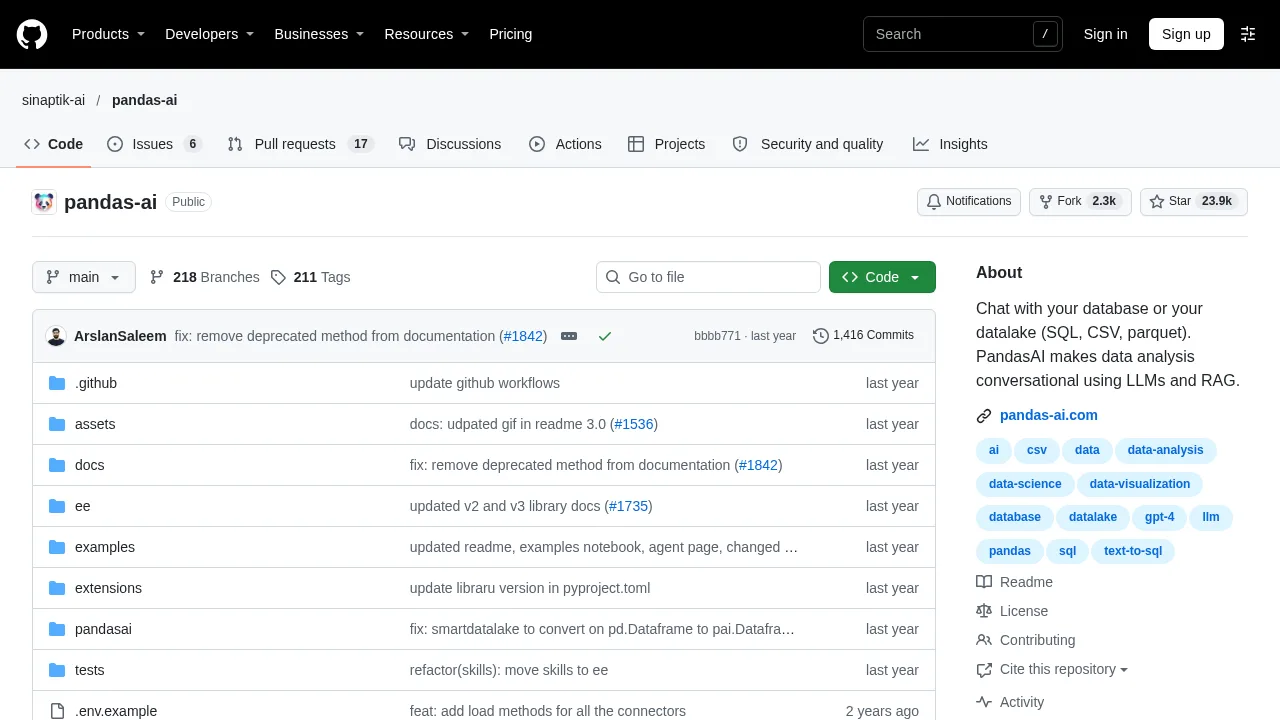
PandasAI lets developers query CSV, Parquet, and SQL data sources using natural language prompts routed through external LLMs.

US
18.73%
645.5M
0
Rose AI

Rose AI

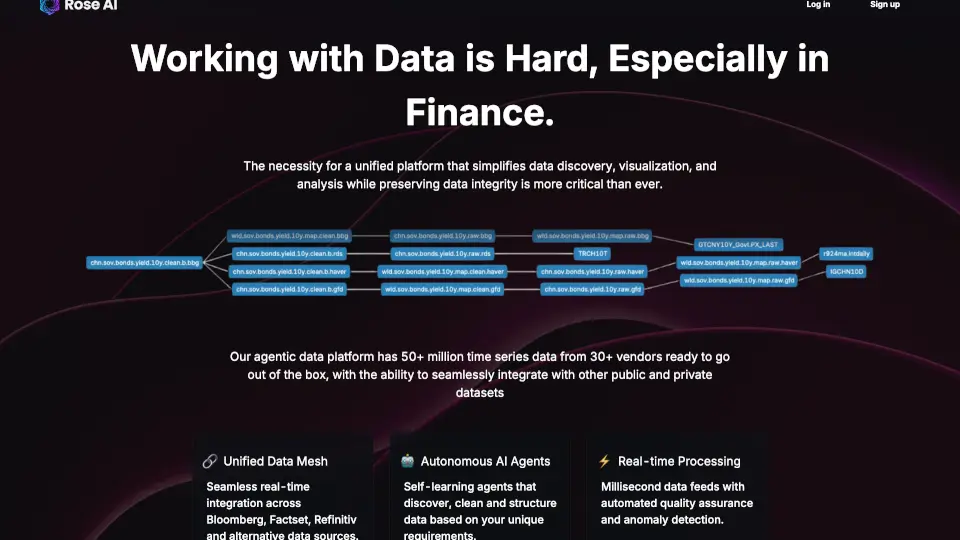
Rose AI is your all-in-one platform for data discovery, visualization, and analysis, designed to save time, foster collaboration, and turn data into actionable insights.

US
33.26%
10.8K
0

Microsoft Power BI Related Other Categories

Microsoft Power BI Traffic Analysis

Website traffic estimates for app.powerbi.com. Visits are not unique users or product usage.

💡 Insights

🚀
Super High Traffic
Over 10M monthly visits. A market leader with extremely high user trust.
➡️
Stable
Traffic remains stable, indicating a mature product.
💎
High Stickiness
Low bounce rate (25%) and deep engagement (6.5 pages/visit). Excellent user experience.
  • Monthly Visits

    56.28M

  • Bounce Rate

    25.28%

  • Pages Per Visit

    6.54

  • Visit Duration

    00:06:17

  • Global Rank

    0

  • Country Rank

    0

Visits Over Time

Traffic Sources

Direct49.73%
Referrals35.32%
Search Organic5.77%
Mail4.33%
Social Organic3.68%
Gen Ai0.65%
Display Ads0.43%
Affiliate0.05%
Social Paid0.04%
Search Paid0.01%

Top Keywords

1
power bi
CPC$1.31
218.28KTraffic
2
powerbi
CPC$1.36
120.67KTraffic
3
power bi login
CPC$3.10
9.12KTraffic
4
power bi service
CPC$2.33
8.42KTraffic
5
powerbi login
CPC$3.90
4.71KTraffic

Top Regions

RegionPercentage
United States
United States
28.63%
Brazil
Brazil
11.89%
India
India
4.84%
United Kingdom
United Kingdom
4.21%
Australia
Australia
3.47%
Low
High

Powered by SimilarWeb

Microsoft Power BI FAQ

What is Microsoft Power BI?

Microsoft Power BI is a business analytics service that provides interactive visualizations and business intelligence capabilities with an interface simple enough for end users to create their own reports and dashboards.

How do I sign up for Power BI?

You can sign up for Power BI by visiting the official website (https://app.powerbi.com/) and entering your email address. Follow the prompts to complete the registration process.

Can I use Power BI with my existing data sources?

Yes, Power BI supports a wide range of data sources, including Excel, SQL Server, and various cloud services. You can easily connect to your existing data sources and start creating visualizations.

Is Power BI free to use?

Power BI offers both free and paid plans. The free plan includes basic features, while the paid plans offer more advanced capabilities and additional storage.

Can I share my Power BI reports with others?

Yes, you can share your Power BI reports and dashboards with others by inviting them to view or collaborate on your content. You can also publish your reports to the web for broader access.

Does Power BI have a mobile app?

Yes, Power BI has a mobile app available for both iOS and Android devices. This allows you to access and interact with your dashboards and reports on the go.

Can I customize my Power BI dashboards?

Absolutely! Power BI allows you to customize your dashboards with a variety of visualization options, filters, slicers, and other interactive elements to suit your specific needs.

Is there a limit to the amount of data I can use in Power BI?

The amount of data you can use in Power BI depends on your subscription plan. Free plans have some limitations, while paid plans offer more storage and data capacity.

Microsoft Power BI Reviews

0
0 Reviews
Sign Into leave a review

Recent Reviews

No reviews yet

Microsoft Power BI Embed

Use website badges to drive community support for SeekTool.ai. They are easy to embed in your homepage or footer.

Light
Dark
Microsoft Power BI - Featured on SeekTool.aiMicrosoft Power BI - Featured on SeekTool.ai
How to install?