Лучшие Визуализация данных Инструменты и ПО в 2026 году (Бесплатные и Платные)
Инструменты AI, которые преобразуют необработанные данные в визуальные контексты, такие как диаграммы, графики и карты, чтобы помочь людям понять значимость данных.
Похожие категории
Все инструменты

Hex Magic — это умный инструмент для анализа данных, который экономит время и упрощает работу с SQL, Python и визуализацией.
QPR ProcessAnalyzer — это инновационное решение для анализа и оптимизации бизнес-процессов с интеграцией Snowflake.
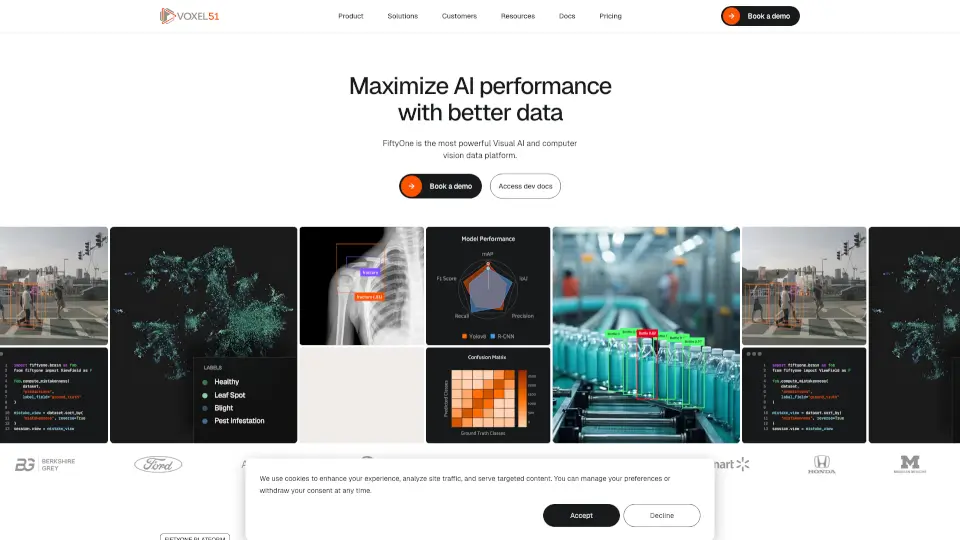
Voxel51 помогает разработчикам визуального ИИ создавать более точные и надежные модели, экономя время и ресурсы.

Graphy — это инструмент, который делает визуализацию данных простой, быстрой и красивой. Создавайте графики, которые вдохновляют и убеждают, без лишних усилий.
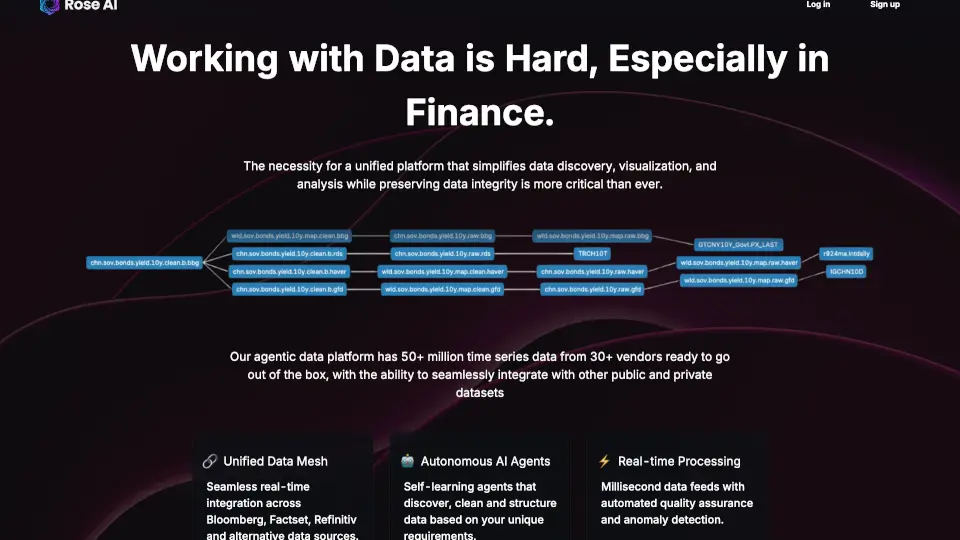
Rose AI — это мощный инструмент для анализа и визуализации данных, который помогает финансовым аналитикам и руководителям принимать обоснованные решения.
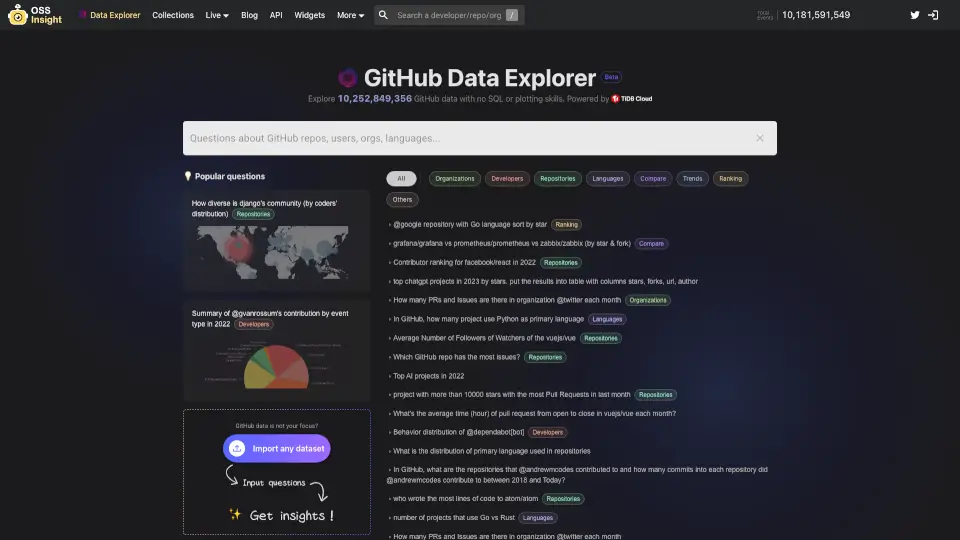
GitHub Data Explorer — это удобный инструмент для анализа данных GitHub с помощью AI, который позволяет получать визуализированные результаты без необходимости знания SQL.
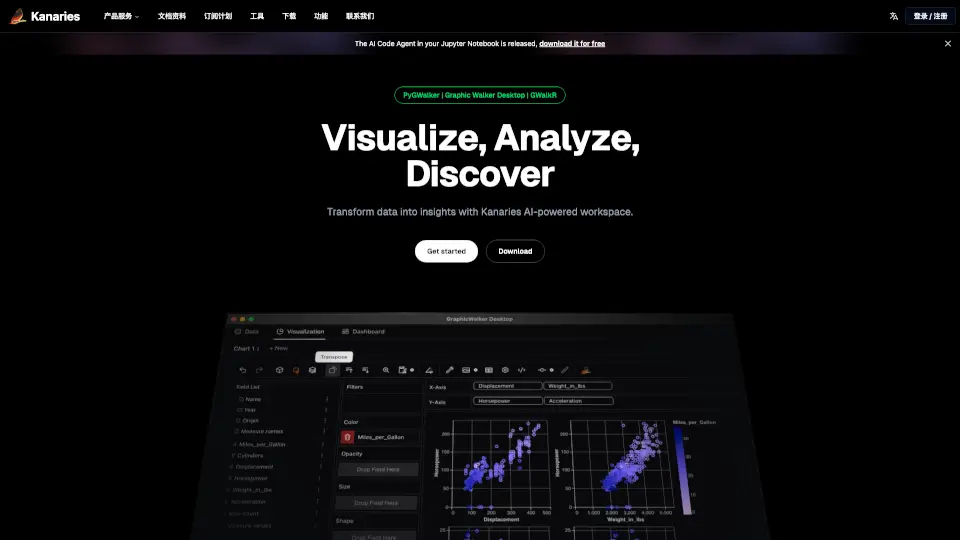
Kanaries — это мощный инструмент для анализа данных, который делает процесс исследования и визуализации простым и доступным для всех.
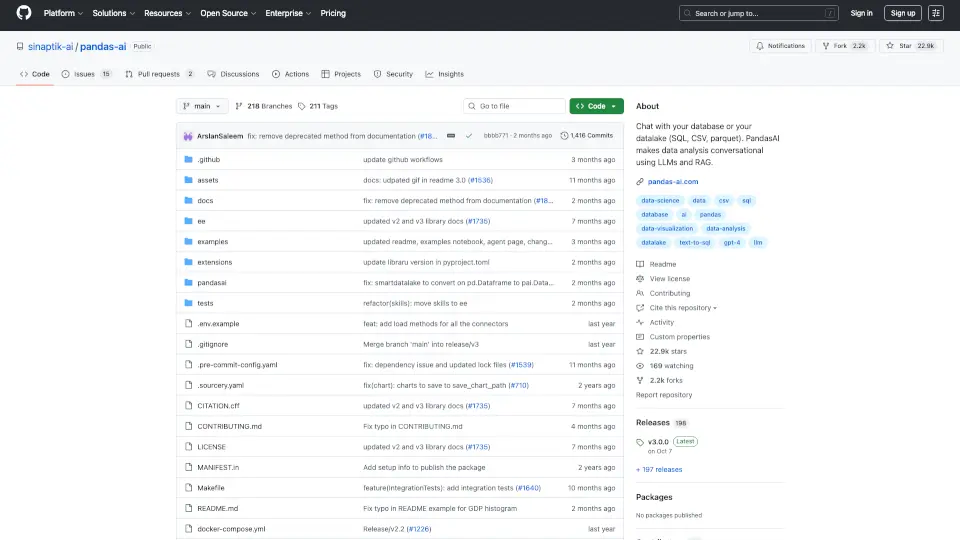
PandasAI — это мощный инструмент для анализа данных, который делает работу с данными простой и интуитивно понятной. Поддерживает различные форматы данных и предоставляет возможность визуализации.
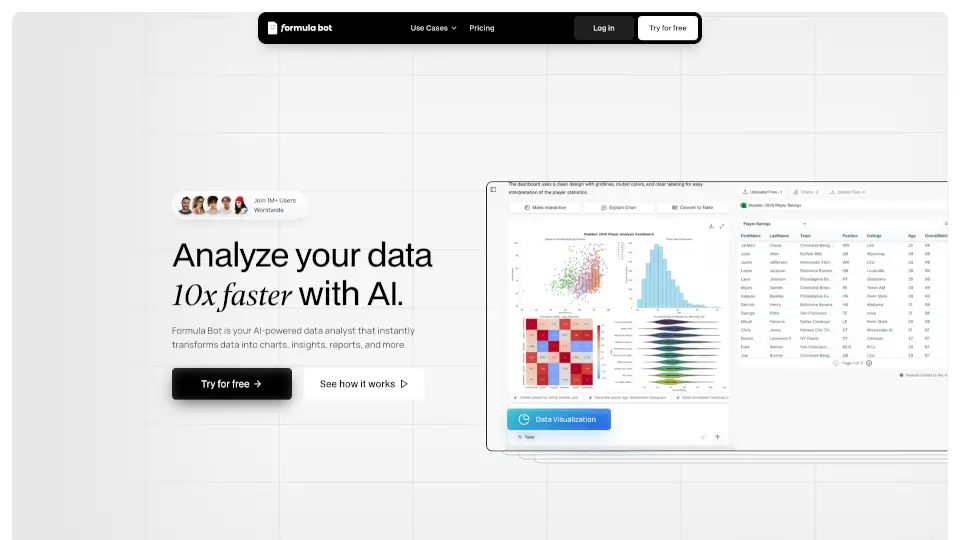
Formula Bot — это мощный инструмент для анализа данных, который делает работу с Excel и другими платформами проще и быстрее благодаря AI.

InfraNodus — это универсальный инструмент для анализа текста, который помогает визуализировать идеи, находить пробелы и генерировать новые инсайты с помощью ИИ.
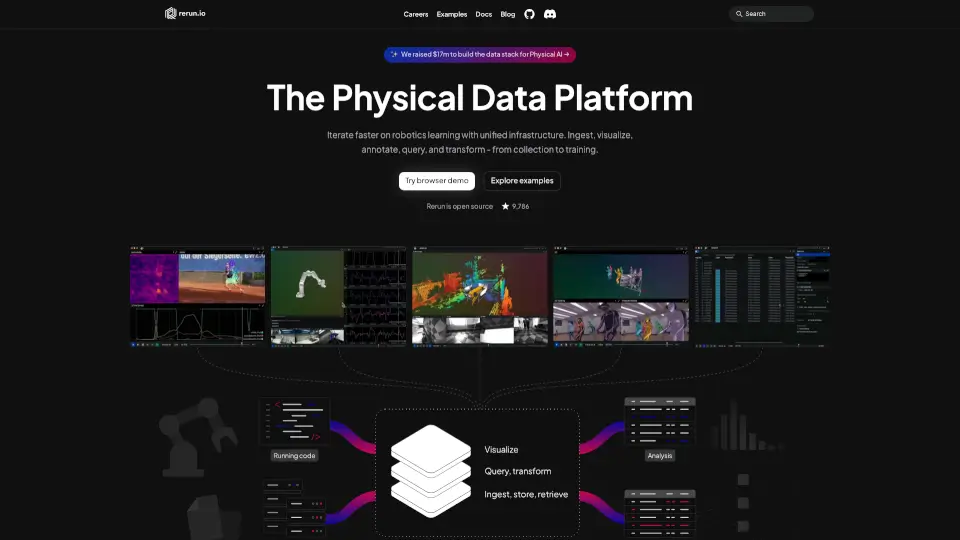
Rerun — это открытый инструмент для визуализации и анализа мультимодальных данных, который делает работу с пространственными и воплощенными системами ИИ быстрой и удобной.
Width.ai — это ваш партнер в мире искусственного интеллекта и машинного обучения, помогающий бизнесам расти и увеличивать прибыль.