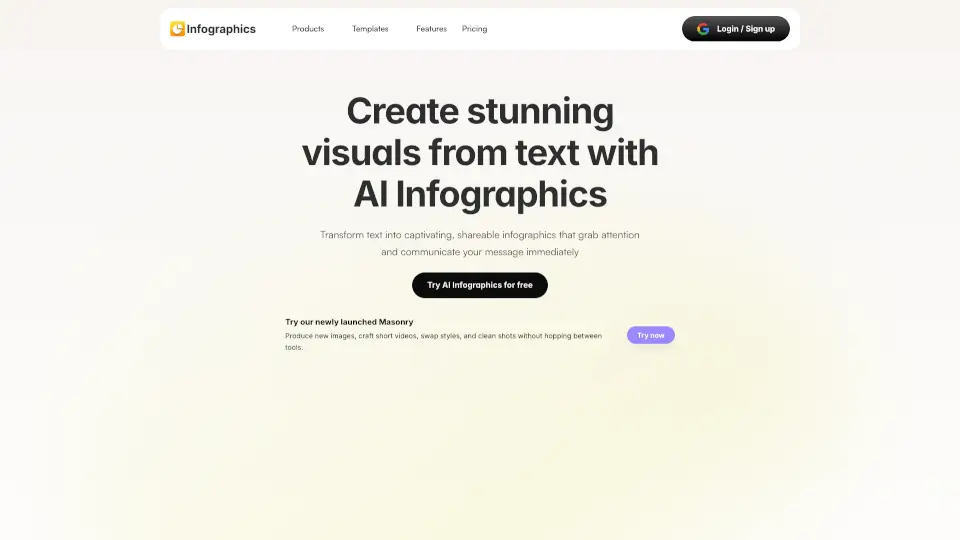
Create stunning infographics easily with Venngage's user-friendly tools.
Best AI Infographic Generator Alternatives & Competitors 2026
A popular AI Infographic Generator tool with 1.3M monthly visits. We've analyzed 20 similar AI tools to help you compare features, popularity, and ratings. Find the perfect alternative for your needs.
Quick Comparison
(Top 5 by Traffic)| Tool | Visits | Top Market | Growth | Rating | Insight | Description |
|---|---|---|---|---|---|---|
AI Infographic GeneratorCurrent | 1.3M | 🇺🇸 United States19.6% | -11.8% | - | 📈High Traffic Over 1M monthly visits. Widely recognized and stable choice. | Create stunning infographics easily with Venngage's user-friendly tools. |
Canva | 870.0M | 🇺🇸 United States15.8% | -10.7% | - | 🚀Super High Traffic Over 10M monthly visits. A market leader with extremely high user trust. | Canva is a free, all-in-one visual communication platform that lets anyone create stunning social graphics, presentations, videos, and print materials using intuitive design tools and AI-powered features. |
Genially | 8.3M | 🇫🇷 France10.2% | -18.7% | - | 📈High Traffic Over 1M monthly visits. Widely recognized and stable choice. | Genially is an all-in-one platform for creating interactive, animated content like presentations, quizzes, and infographics—no coding required. |
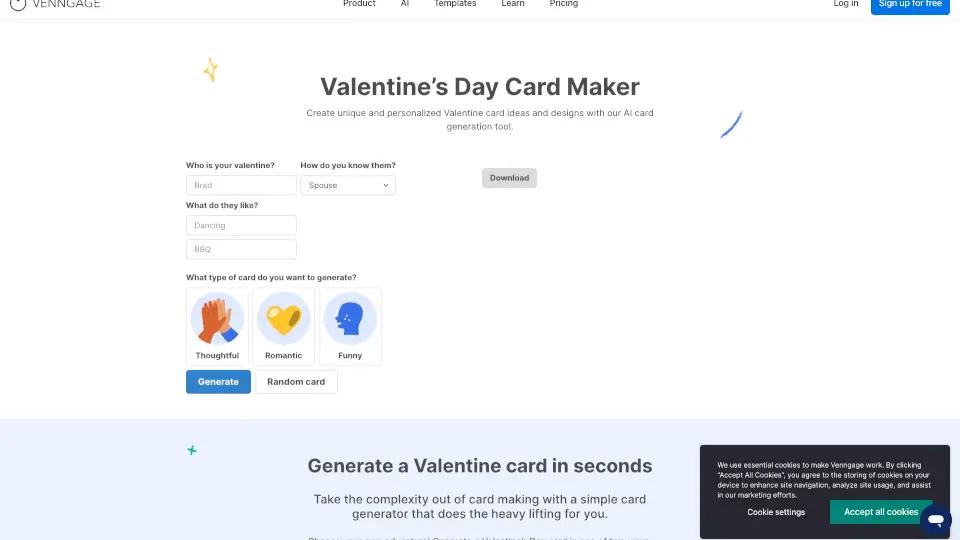
Venngage | 1.3M | 🇺🇸 United States19.6% | -11.8% | - | 📈High Traffic Over 1M monthly visits. Widely recognized and stable choice. | Create personalized Valentine’s Day cards effortlessly with Venngage’s AI-powered card generator. Perfect for expressing love and appreciation. |
Visme | 1.1M | 🇺🇸 United States16.7% | -11.7% | - | 📈High Traffic Over 1M monthly visits. Widely recognized and stable choice. | Visme is an all-in-one design platform that helps you create professional presentations, infographics, and one-pagers with ease, even if you have no design experience. |
Piktochart | 752.0K | 🇺🇸 United States13.1% | -18.2% | - | ⭐Medium Scale 100K-1M monthly visits. Growing tool with active development. | Piktochart makes creating stunning visuals easy and fast, perfect for anyone looking to enhance their communication. |
Data based on traffic metrics from June 2026
Closest Match
Tools that are functionally closest to AI Infographic Generator, ranked by semantic similarity and category relevance.
📉Traffic Decline
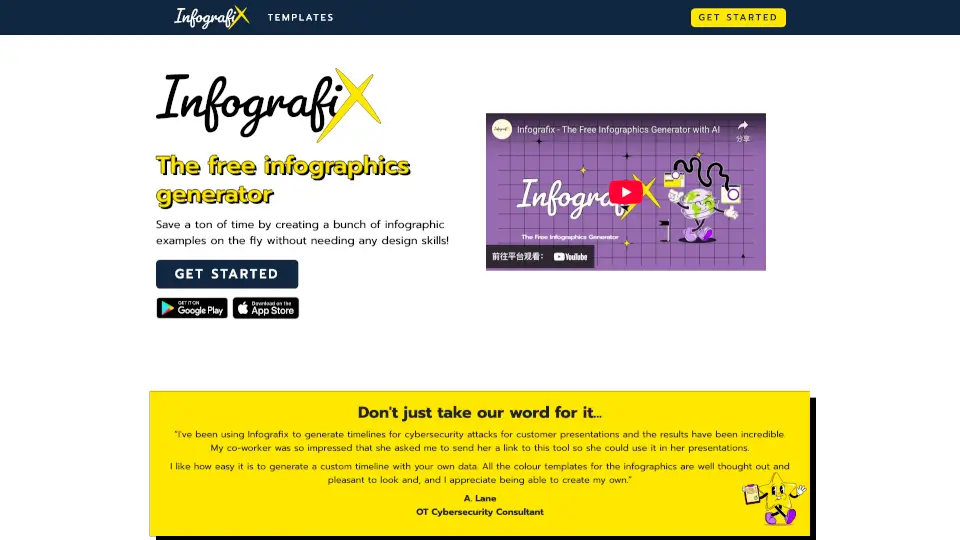
Create stunning infographics effortlessly with Infografix, the free tool that uses AI to simplify your design process.
27.9K
|4.0
📉Traffic Decline
Transform text into pro infographics in seconds—no design skills needed. Perfect for blogs, social media, and reports. Free to start, with unlimited options for power users.
2.5K
|3.0

📉Traffic Decline
Transform your text into stunning infographics in minutes with Text to Infographic, the AI-powered design tool.
22.0K
|4.0
📈High Traffic
Create personalized Valentine’s Day cards effortlessly with Venngage’s AI-powered card generator. Perfect for expressing love and appreciation.
1.3M
|5.0
Similar Traffic Scale
Alternatives with comparable monthly traffic to AI Infographic Generator, useful for comparing peers at a similar market stage.
📈High Traffic
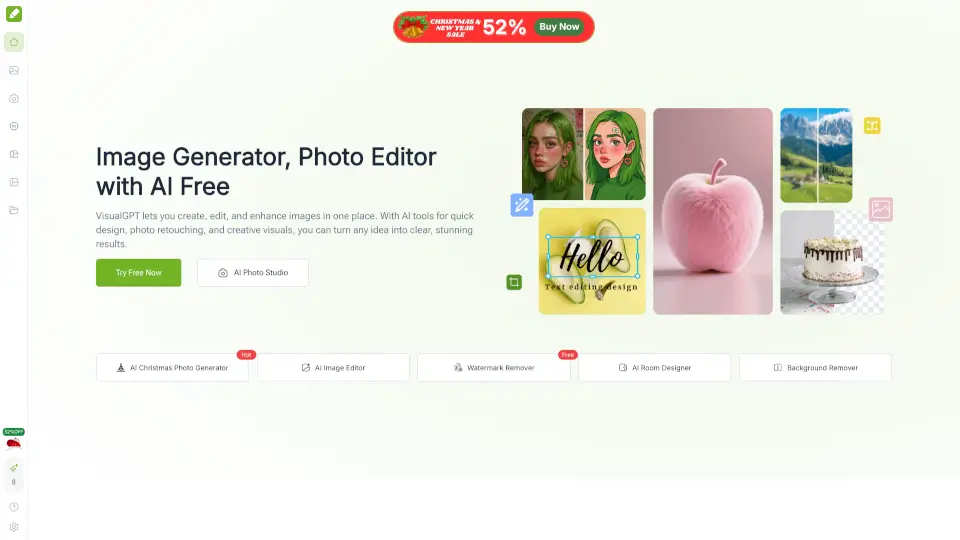
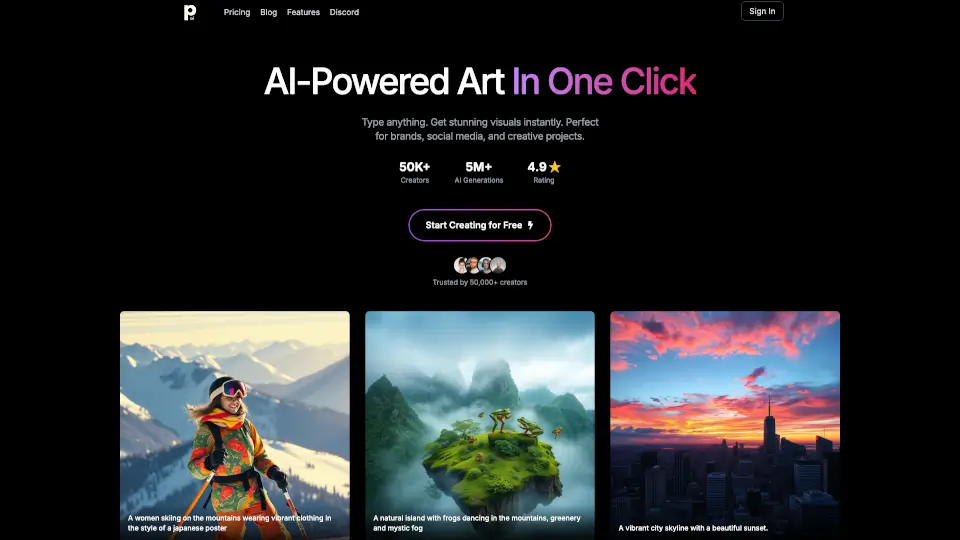
VisualGPT is a free, web-based AI image platform for fast, high-quality creation, editing, and design—perfect for anyone, from marketers to hobbyists.
1.3M
|5.0
📈High Traffic
Visme is an all-in-one design platform that helps you create professional presentations, infographics, and one-pagers with ease, even if you have no design experience.
1.1M
|5.0
📈High Traffic
Napkin AI is the ultimate tool for transforming text into visuals, making your communication more effective and engaging.
1.6M
|5.0
📈High Traffic
Free Online AI Presentation Maker is a game-changer for creating professional presentations effortlessly. Perfect for business owners, educators, and entrepreneurs.
1.0M
|5.0
Fast Growing Alternatives
Similar tools with stronger recent traffic growth, highlighting alternatives that may be gaining momentum.
🔥Explosive Growth
AI PPT Maker is a fast, free tool that turns your content into professional slides in seconds. Perfect for everyone!
16.4K
|4.0
🔥Explosive Growth
Create stunning visuals effortlessly with PhotoGenius.ai's powerful AI tools.
2.8K
|3.0
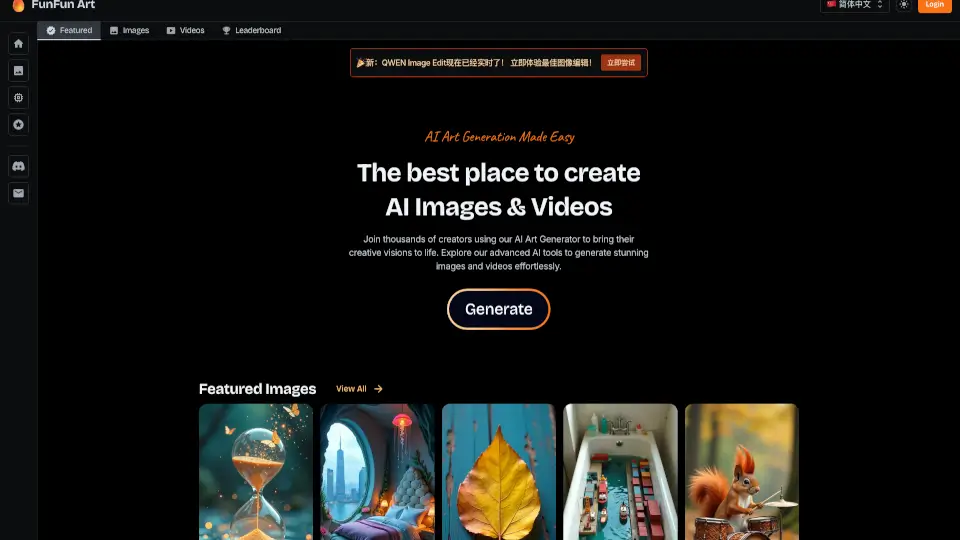
🔥Explosive Growth
Create stunning AI images and videos effortlessly with FunFun Art.
393.9K
|5.0
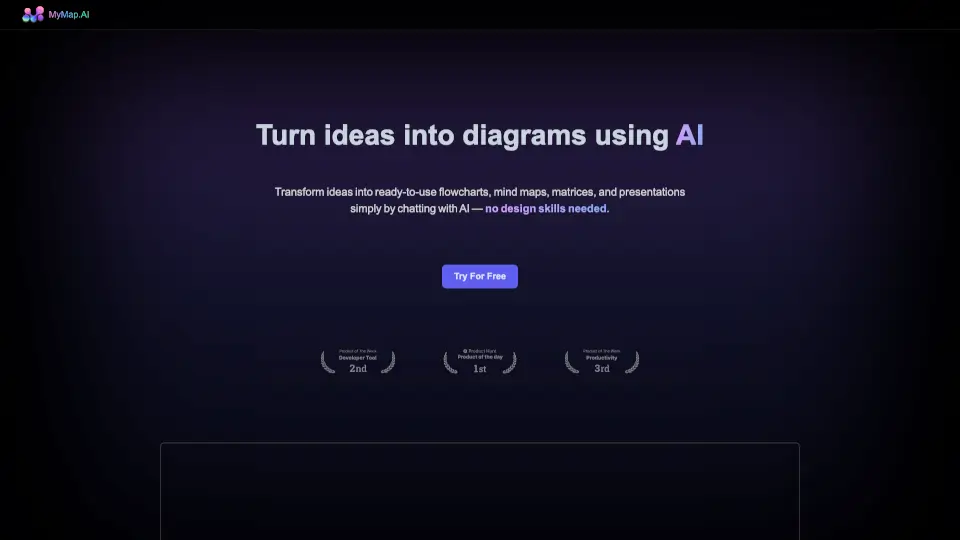
📊Steady Growth
MyMap AI turns ideas into diagrams effortlessly, making it perfect for students, professionals, and content creators. No design skills needed—just chat and create!
253.0K
|5.0
Top 20 Alternatives to AI Infographic Generator
Sorted by Similarity📉Traffic Decline
Create stunning infographics effortlessly with Infografix, the free tool that uses AI to simplify your design process.
27.9K
|4.0
📉Traffic Decline
Transform text into pro infographics in seconds—no design skills needed. Perfect for blogs, social media, and reports. Free to start, with unlimited options for power users.
2.5K
|3.0
📉Traffic Decline
Transform your text into stunning infographics in minutes with Text to Infographic, the AI-powered design tool.
22.0K
|4.0
📈High Traffic
Create personalized Valentine’s Day cards effortlessly with Venngage’s AI-powered card generator. Perfect for expressing love and appreciation.
1.3M
|5.0
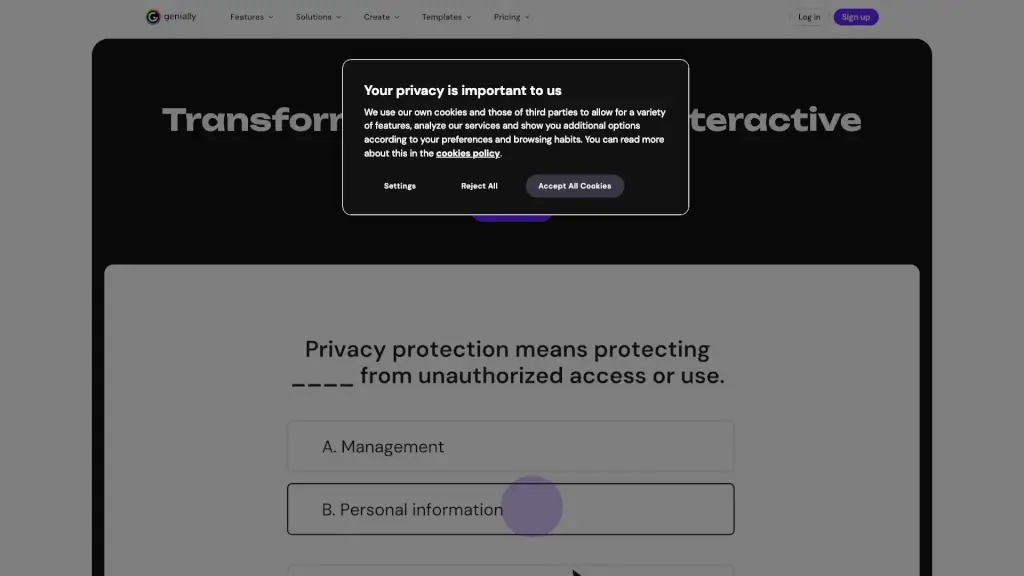
📈High Traffic
Genially is an all-in-one platform for creating interactive, animated content like presentations, quizzes, and infographics—no coding required.
8.3M
|5.0
📊Steady Growth
Create stunning, AI-generated charts in seconds with the AI Graph Maker. Perfect for students, professionals, and anyone who wants to visualize data effortlessly.
30.0K
|4.0
📈High Traffic
Visme is an all-in-one design platform that helps you create professional presentations, infographics, and one-pagers with ease, even if you have no design experience.
1.1M
|5.0
⭐Medium Scale
Piktochart makes creating stunning visuals easy and fast, perfect for anyone looking to enhance their communication.
752.0K
|5.0
⭐Medium Scale
Tenorshare AI Diagrimo is a free, AI-powered diagram generator that quickly turns your ideas into clear, customizable diagrams and infographics, making communication faster and clearer.
331.1K
|5.0

🚀Super High Traffic
Canva is a free, all-in-one visual communication platform that lets anyone create stunning social graphics, presentations, videos, and print materials using intuitive design tools and AI-powered features.
870.0M
|5.0
📈High Traffic
Napkin AI is the ultimate tool for transforming text into visuals, making your communication more effective and engaging.
1.6M
|5.0
📊Steady Growth
MyMap AI turns ideas into diagrams effortlessly, making it perfect for students, professionals, and content creators. No design skills needed—just chat and create!
253.0K
|5.0
📈High Traffic
VisualGPT is a free, web-based AI image platform for fast, high-quality creation, editing, and design—perfect for anyone, from marketers to hobbyists.
1.3M
|5.0

📈High Traffic
Ideogram is an AI-powered platform that helps users create, share, and explore engaging visual stories with customizable templates and collaborative tools.
3.0M
|5.0
🌱Emerging Tool
PageOn is the AI-native tool that makes visual communication effortless. Create slides, charts, 3D models, and more—just by describing your vision. Perfect for pros and beginners alike.
76.4K
|5.0
⭐Medium Scale
EdrawMax Online is a versatile diagramming tool that empowers users to create stunning visuals effortlessly.
390.0K
|5.0
⭐Medium Scale
Presentations.AI is a simple, fast, and fun AI tool that turns your ideas into professional presentations in minutes. Perfect for businesses, educators, and personal projects.
898.6K
|5.0
⭐Medium Scale
Edraw.AI is an AI-powered visual collaboration platform with 40+ tools and 700+ templates to help teams create, collaborate, and manage projects efficiently. ---
305.3K
|5.0

🚀Super High Traffic
Venice is a private, uncensored AI platform for text, image, and code generation, ensuring your data stays secure.
13.2M
|5.0
📉Traffic Decline
Create stunning, high-quality AI images instantly with our free, easy-to-use AI Image Generator. Perfect for social media, projects, and more!
18.0K
|4.0
Frequently Asked Questions
How we find and rank alternatives to AI Infographic Generator
Semantic AlgorithmPowered by SimilarWebNo Paid Placements
We generate a semantic embedding (vector) for every AI tool in our database. Alternatives are found by first narrowing candidates to tools in the same categories, then ranking by cosine similarity score. Only tools with a similarity score ≥ 0.52 make the cut — ensuring every recommendation is genuinely related, not just popular in the same broad category.
The full list (up to 20 tools) is ordered by semantic similarity — the most functionally similar tools appear first. "Quick Comparison" goes one step further: it takes the top candidates from that list and re-ranks them by monthly traffic, giving you a fast snapshot of the most widely-used options right now.
Quick Comparison has fewer slots and adds a traffic threshold on top of similarity. A tool can be highly similar to the one you are looking at but still have lower monthly traffic than other candidates — it stays in the full list where you can still discover and evaluate it.
Monthly visits, growth rates, and regional distribution data are sourced from SimilarWeb via our licensed API. SimilarWeb is the industry-standard web analytics service used by analysts, investors, and product teams worldwide. The data month is displayed at the bottom of the Quick Comparison table.
Similarity relationships are recalculated periodically as new tools are added to our database. Traffic metrics (visits, growth rate, top market) are refreshed monthly from SimilarWeb. The exact data month is always shown at the bottom of the Quick Comparison table so you know how fresh the numbers are.
No. The order of results is determined entirely by our similarity algorithm and third-party traffic data. We do not sell placement positions in alternative lists or Quick Comparison tables. If a tool is listed here, it earned its place through data — not through advertising spend.
Traffic data (visits, growth, top market) sourced from SimilarWeb licensed API · Similarity scores computed by our in-house vector engine