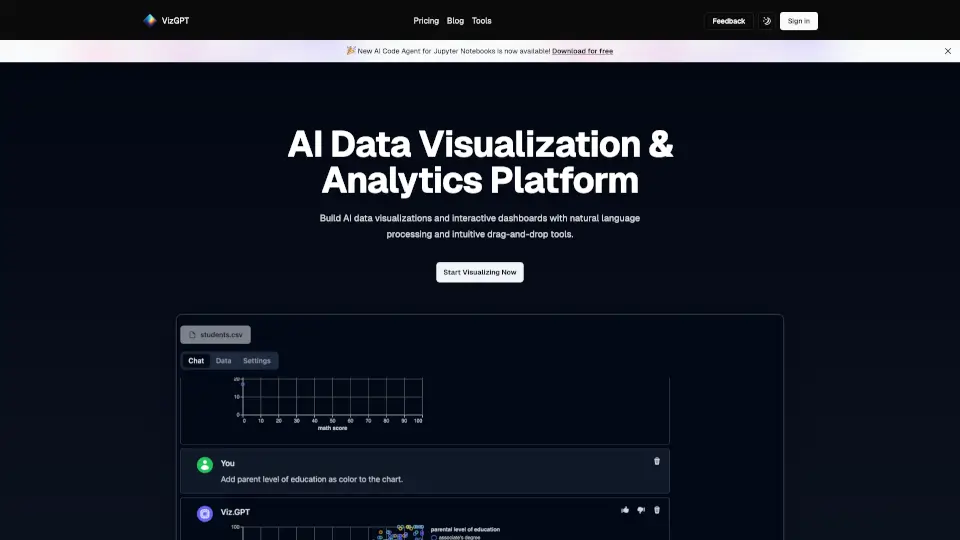
What is vizGPT?
Meet vizGPT, your new AI data visualization assistant! With vizGPT, you can transform your raw data into interactive charts and analytics dashboards in no time. Whether you're a student, a professional, or just someone who loves to make sense of numbers, vizGPT makes it easy. Just type in what you want to see, and our smart AI will do the rest. No more struggling with complex software or syntax errors—just plain, simple language.
What are the features of vizGPT?
- Natural Language Processing (NLP): Our advanced NLP understands your questions and turns them into visualizations instantly.
- Real-Time Responses: Ask a question, get a chart. It's that fast and simple.
- Contextual Memory: vizGPT remembers past queries, so you can pick up right where you left off.
- Drag-and-Drop Interface: Use the intuitive drag-and-drop tools to create and customize your visualizations.
- Collaborative Analytics: Share insights with your team, invite comments, and build dashboards together.
- Data Transformation and Profiling: Easily prepare and profile your data for better analysis.
What are the use cases of vizGPT?
- Student Projects: Quickly create charts and dashboards for school presentations.
- Business Reports: Generate professional-looking reports and dashboards for meetings.
- Market Analysis: Visualize market trends and customer data for better decision-making.
- Research Studies: Turn complex research data into easy-to-understand visualizations.
- Team Collaboration: Work with your team to build and share data-driven stories.
- Personal Finance: Track and visualize your personal finances for better budgeting.
How to use vizGPT?
- Start by Signing In: Create an account or sign in to get started.
- Upload Your Data: Import your data from various sources like spreadsheets or databases.
- Ask Questions: Type in your data visualization requests in plain language.
- Customize Your Charts: Use the drag-and-drop interface to tweak and refine your visualizations.
- Share and Collaborate: Invite team members to view, comment, and contribute to your dashboards.
- Save and Export: Save your work and export your visualizations for presentations or reports.