What is Bricks?
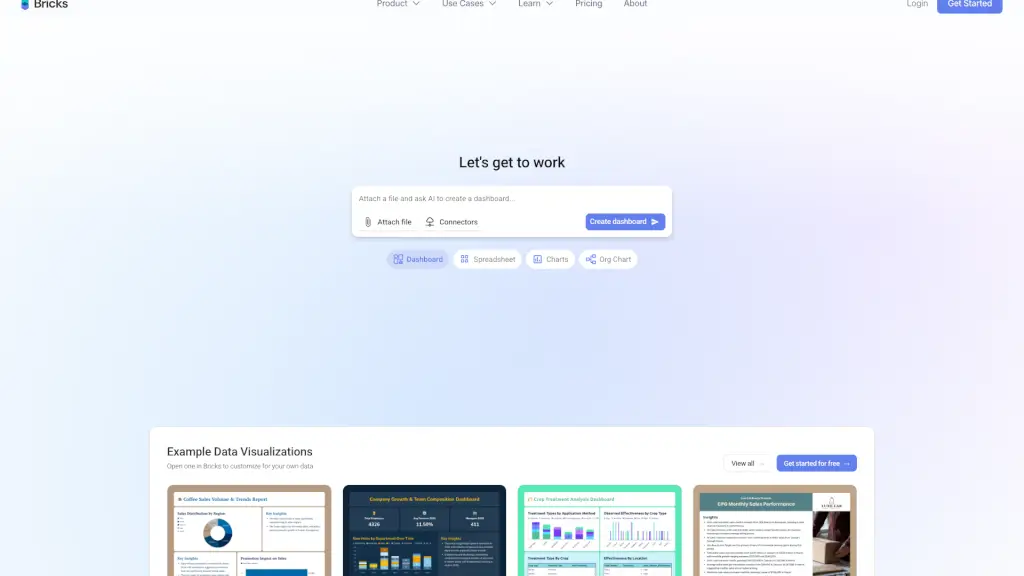
Bricks is an AI-powered tool that turns your CSV and Excel files into professional dashboards and reports in seconds—no coding, design skills, or data team required. If you’ve ever wasted hours formatting charts in Excel or struggled with complex tools like Tableau, Bricks offers a simpler, smarter alternative. It combines the visual polish of Canva with the data-handling power of business intelligence tools, but built for real people—not just analysts.
Whether you're in sales, HR, finance, or education, Bricks helps you unlock insights from everyday spreadsheets and share them as beautiful, interactive dashboards or slide decks. Just upload your data, and let AI do the heavy lifting while you focus on decisions, not formulas.
What are the features of Bricks?
- AI-Powered Dashboards: Upload a CSV or Excel file and get a fully visualized dashboard instantly, customized by AI based on your data.
- One-Click Data Refresh: Update your source file and regenerate all charts while keeping your layout intact—perfect for recurring reports.
- Interactive Filtering: Click any chart element to filter the entire dashboard and explore hidden trends without rebuilding visuals.
- AI Spreadsheet Editor: Clean, transform, and analyze data directly in Bricks using simple natural language commands.
- Data-to-Slides & Org Charts: Turn datasets into presentation-ready slide decks or organizational charts with one click.
- Drag-and-Drop Customization: Manually tweak every element or use AI to adjust layouts, colors, and labels—full creative control.
- 100+ Connectors: Pull live data from Google Sheets, Salesforce (coming soon), Stripe, QuickBooks, Airtable, and more.
What are the use cases of Bricks?
- A retail manager creates sales and inventory dashboards from weekly Excel exports in under a minute.
- An HR leader analyzes employee turnover trends and builds a workforce insights report without IT support.
- A nonprofit coordinator turns donor and campaign data into compelling monthly performance slides for board meetings.
- A hospital administrator visualizes patient admission patterns from CSV files to spot seasonal demand spikes.
- A startup founder tracks cash flow and runway using bank export data, generating investor-ready financial summaries.
- A marketing agency delivers client campaign reports by connecting Google Ads and Mailchimp data directly into Bricks.
How to use Bricks?
- Upload your file: Drag and drop a CSV, Excel file, or connect a live source like Google Sheets.
- Let AI generate your dashboard: Bricks auto-detects key metrics and creates relevant charts (bar, line, funnel, heatmap, etc.).
- Customize with AI or manually: Use natural language prompts (“Make this chart show quarterly trends”) or drag elements to rearrange.
- Add filters and interactivity: Enable cross-filtering so clicking a region updates all related visuals.
- Save as a template: Reuse your layout with new data next week or next month—no rebuilding needed.
- Export or share: Send as a live link, embed in internal tools, or download as slides, PDFs, or images.