

Power Query est un outil puissant pour la transformation et la préparation de données, intégré dans les produits Microsoft comme Excel et Power BI.
Meilleures alternatives et concurrents à Power Query 2026
Un outil de Ingénierie des données et ETL avec IA populaire avec 90.1M visites mensuelles. Nous avons analysé 15 outils d'IA similaires pour vous aider à comparer fonctionnalités, popularité et évaluations. Trouvez l'alternative parfaite.
Comparaison rapide
(Top 5 par trafic)| Outil | Visites | Marché principal | Croissance | Note | Analyse | Description |
|---|---|---|---|---|---|---|
 Power QueryActuel | 90.1M | 🇺🇸 United States20.6% | -2.2% | - | 🚀Trafic très élevé Plus de 10M visites mensuelles. Leader du marché avec une confiance utilisateur extrême. | Power Query est un outil puissant pour la transformation et la préparation de données, intégré dans les produits Microsoft comme Excel et Power BI. |
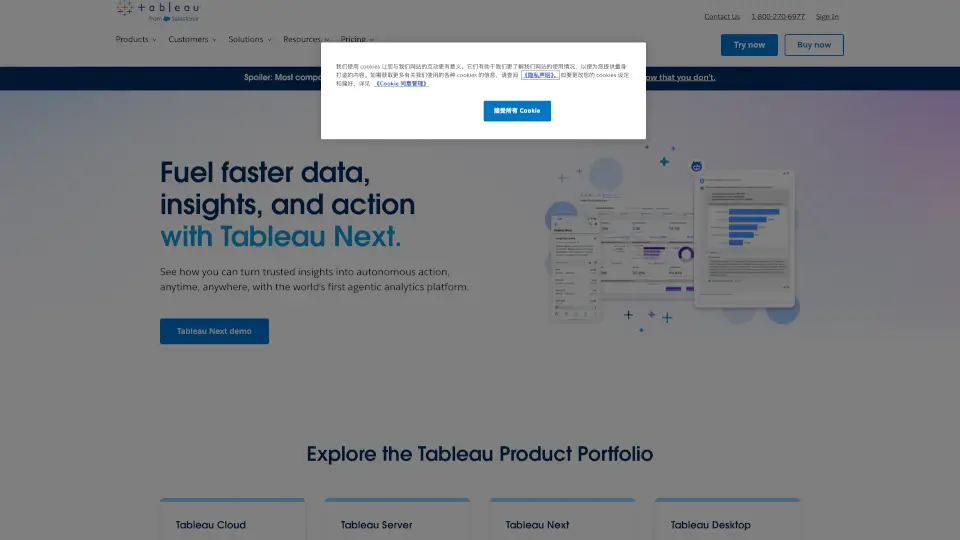
 Tableau | 6.5M | 🇺🇸 United States38.3% | -8.2% | - | 📈Trafic élevé Plus de 1M visites mensuelles. Largement reconnu et choix stable. | Tableau est un outil de Business Intelligence et d'analyse de données qui permet de visualiser, comprendre et partager des informations de manière simple et intuitive, aidant les organisations à prendre des décisions éclairées. |
 Qlik AutoML | 919.5K | 🇺🇸 United States15.8% | -20.3% | - | ⭐Échelle moyenne 100K-1M visites mensuelles. Outil en croissance avec développement actif. | Qlik est une plateforme tout-en-un pour l'intégration de données, l'analytique et l'IA, conçue pour aider les entreprises à prendre des décisions basées sur les données. |
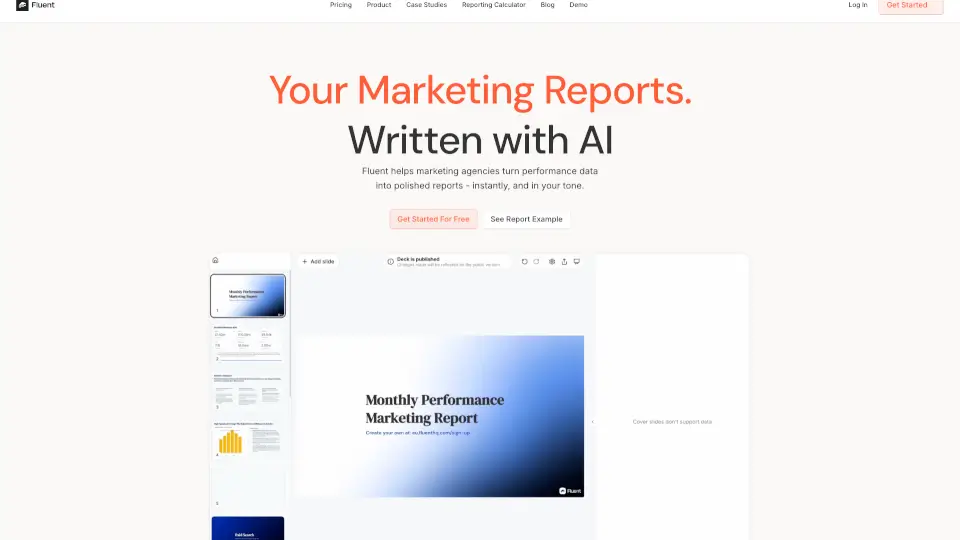
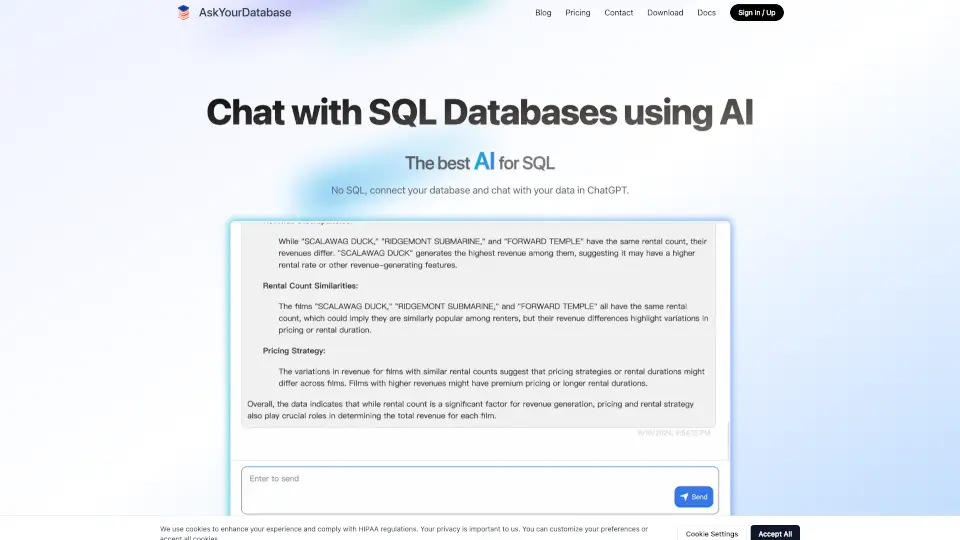
 Rows | 217.1K | 🇺🇸 United States7.5% | -14.5% | - | ⭐Échelle moyenne 100K-1M visites mensuelles. Outil en croissance avec développement actif. | Rows est une plateforme d’analyse par IA qui vous permet de transformer facilement des données issues de PDF, banques, APIs et outils en insights exploitables, sans code ni inscription. |
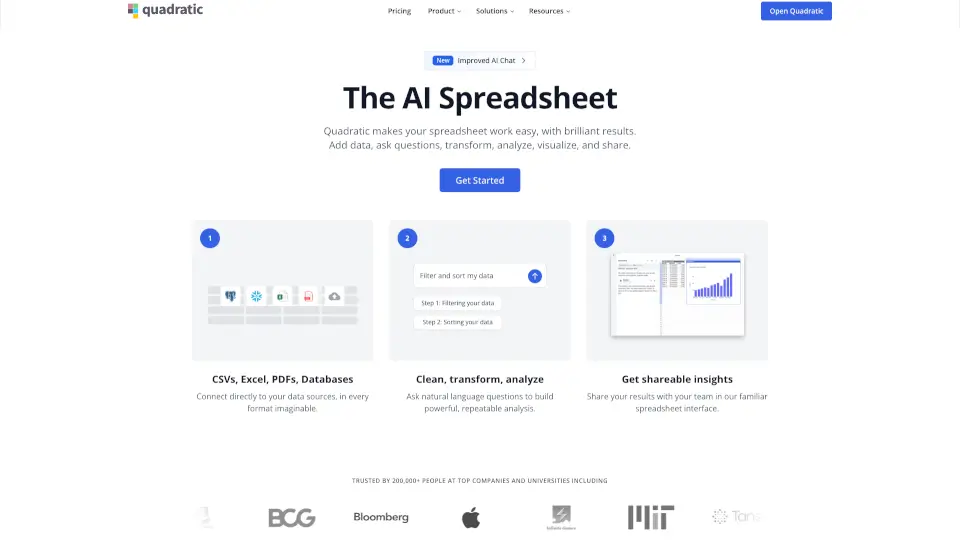
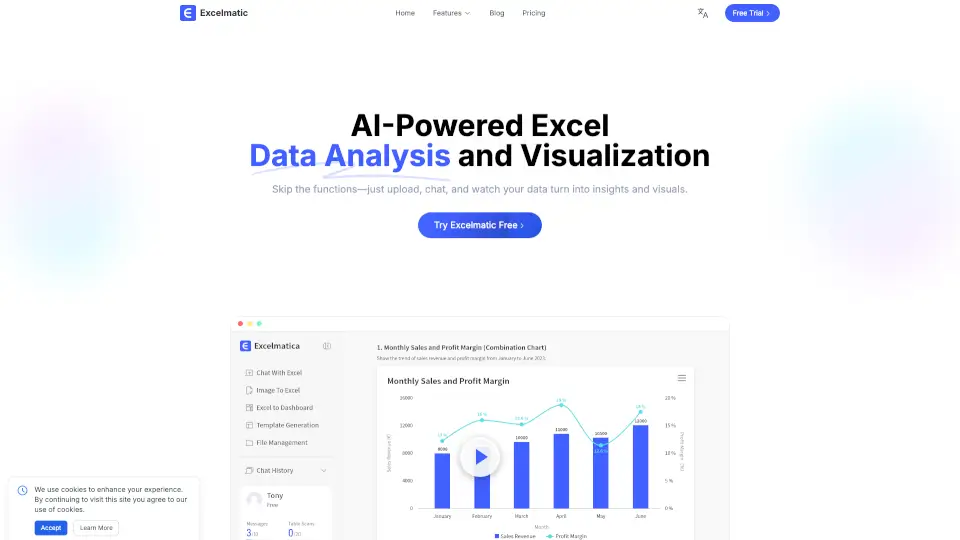
 Quadratic | 111.2K | 🇮🇳 India30.3% | -25.5% | - | ⭐Échelle moyenne 100K-1M visites mensuelles. Outil en croissance avec développement actif. | Quadratic est une feuille de calcul AI qui facilite l'analyse et la visualisation des données. |
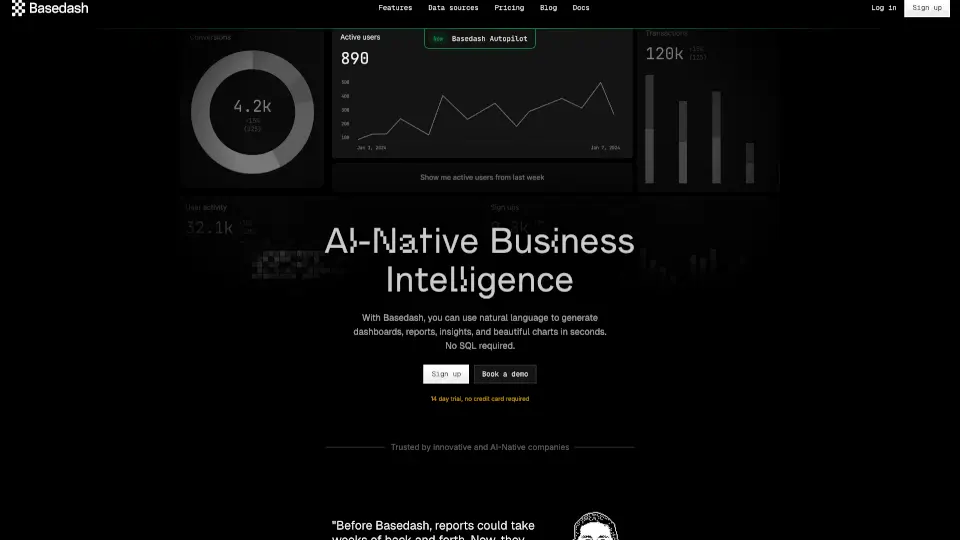
 Basedash | 43.4K | 🇺🇸 United States27.9% | -21.8% | - | 📉Baisse du trafic Baisse significative du trafic. Envisagez des alternatives. | Basedash facilite la création de tableaux de bord et de graphiques à partir de vos données, le tout en utilisant un langage naturel. |
Données basées sur les métriques de trafic de août 2026
Correspondance la plus proche
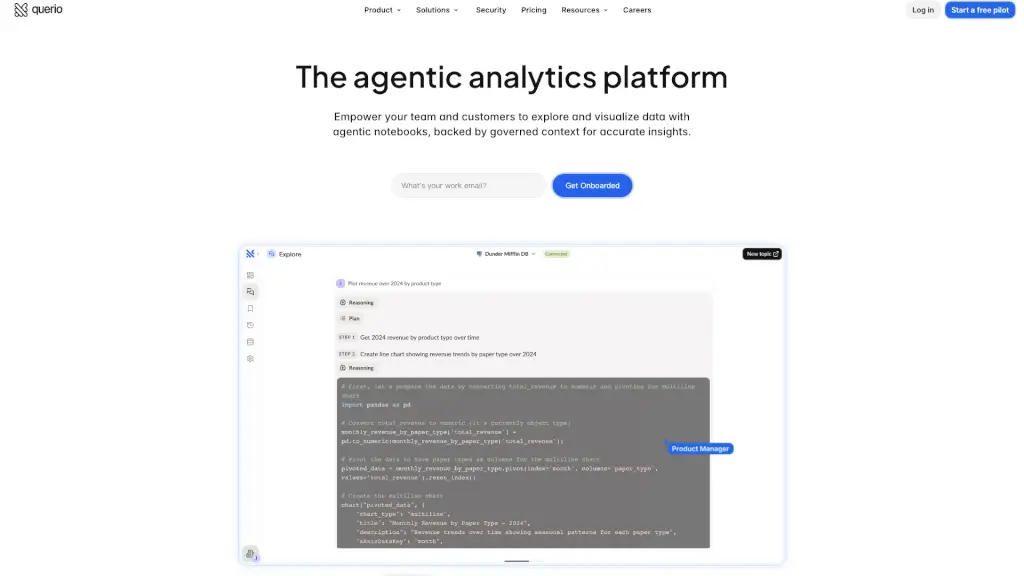
Outils les plus proches fonctionnellement de Power Query, classés par similarité sémantique et pertinence de catégorie.




Alternatives en forte croissance
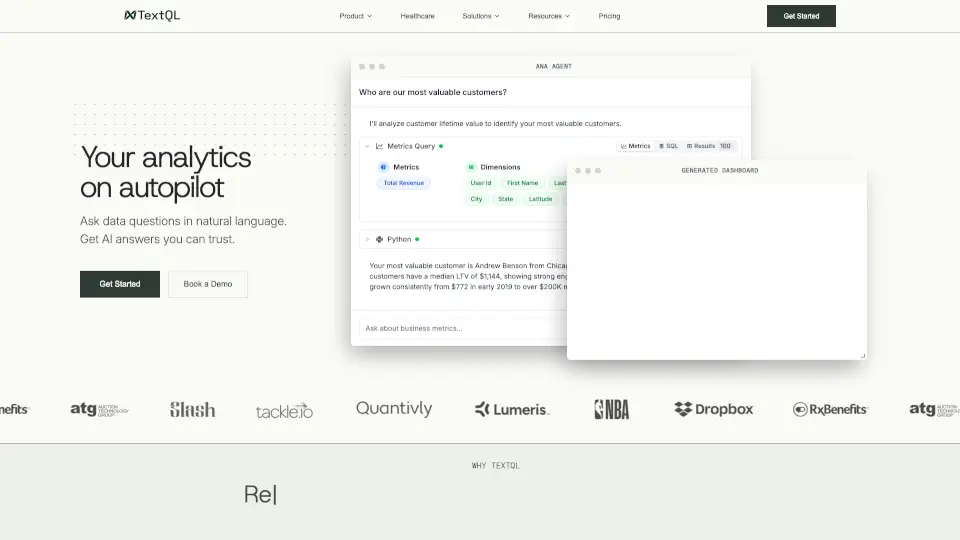
Outils similaires avec une croissance récente du trafic plus forte, pour repérer les options qui gagnent en traction.
Top 15 Alternatives à Power Query
Trié par similarité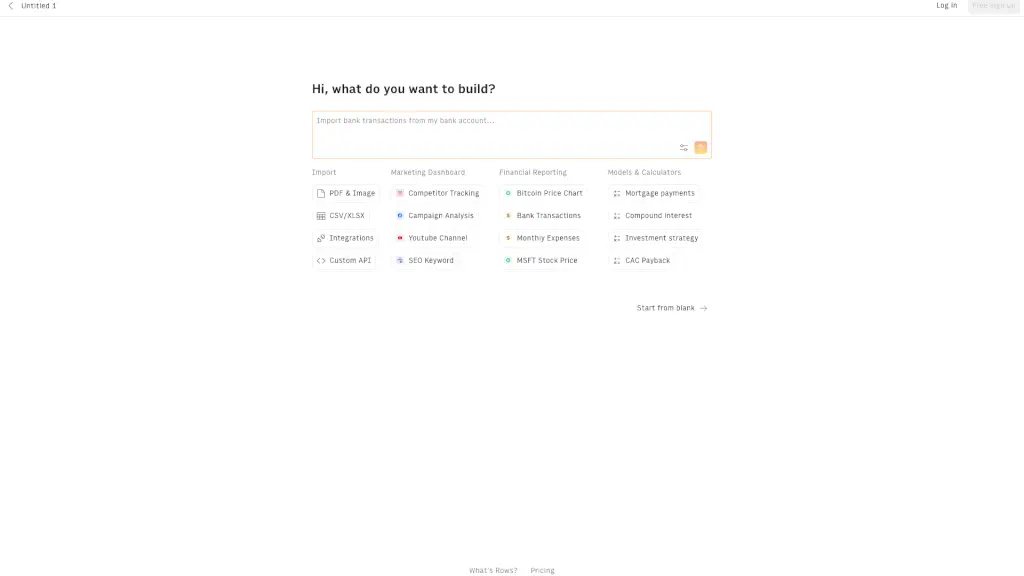


Questions fréquentes
Comment nous trouvons et classons les alternatives à Power Query
Algorithme sémantiqueDonnées SimilarWebAucun placement payant
Nous générons un vecteur sémantique (embedding) pour chaque outil IA de notre base de données. Les alternatives sont trouvées en limitant d'abord les candidats aux outils des mêmes catégories, puis en classant par score de similarité cosinus. Seuls les outils avec un score ≥ 0,52 sont retenus, garantissant que chaque recommandation est réellement pertinente et pas simplement populaire dans la même catégorie.
La liste complète (jusqu'à 20 outils) est classée par similarité sémantique : les outils fonctionnellement les plus proches apparaissent en premier. La « Comparaison rapide » va plus loin : elle prend les meilleurs candidats et les reclasse par trafic mensuel, vous offrant un aperçu rapide des options les plus utilisées actuellement.
La Comparaison rapide dispose de moins de places et ajoute un seuil de trafic en plus de la similarité. Un outil peut être très similaire mais avoir moins de trafic mensuel que d'autres candidats ; il reste dans la liste complète où vous pouvez quand même le découvrir et l'évaluer.
Les visites mensuelles, les taux de croissance et la distribution régionale proviennent de SimilarWeb via notre API sous licence. SimilarWeb est le service d'analyse web standard de l'industrie, utilisé par des analystes, des investisseurs et des équipes produit dans le monde entier. Le mois des données est affiché en bas du tableau de Comparaison rapide.
Les relations de similarité sont recalculées régulièrement au fur et à mesure que de nouveaux outils sont ajoutés à la base de données. Les métriques de trafic sont actualisées mensuellement depuis SimilarWeb. Le mois exact des données est toujours visible en bas du tableau de Comparaison rapide pour vous permettre d'évaluer la fraîcheur des informations.
Non. L'ordre des résultats est entièrement déterminé par notre algorithme de similarité et les données de trafic tierces. Nous ne vendons pas de positions dans les listes d'alternatives ni dans les tableaux de Comparaison rapide. Si un outil figure ici, il a mérité sa place grâce aux données, et non à un budget publicitaire.
Données de trafic (visites, croissance, marché principal) via l'API SimilarWeb sous licence · Scores de similarité calculés par notre moteur vectoriel interne