What is Rows?
Tired of wrestling with spreadsheets, SQL queries, or complex data tools just to get simple answers from your data? Rows is an AI-powered analyst platform that lets you connect, transform, and analyze data from almost anywhere—without writing a single line of code. Whether your data lives in PDFs, bank statements, Google Sheets, databases, or APIs, Rows pulls it all together so you can ask questions in plain English and get instant insights.
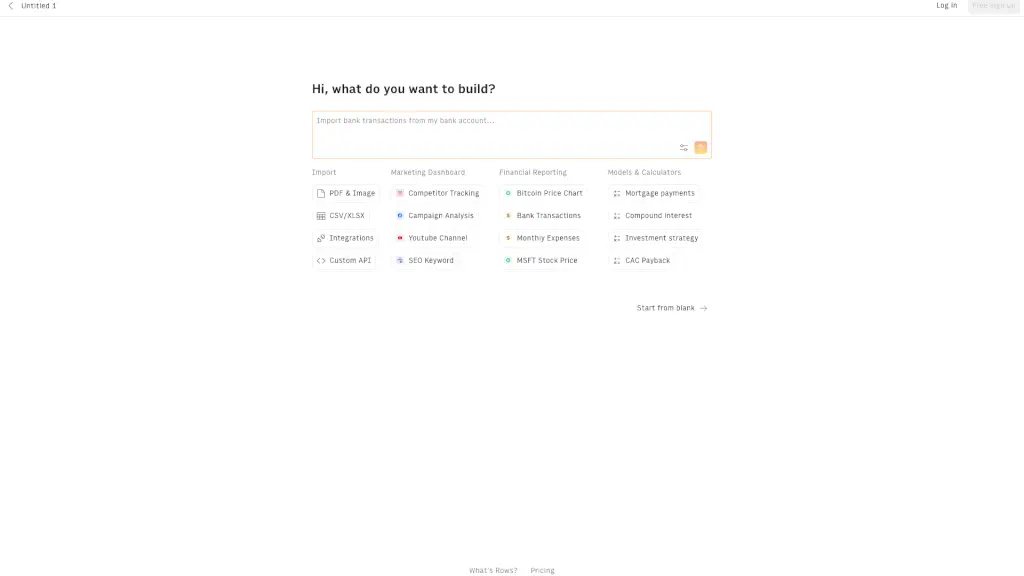
Think of Rows as your personal data assistant: it handles the messy technical work while you focus on what matters—making smarter decisions faster. Best of all? You don’t need to sign up to try it. Just head to the site, start connecting sources, and let AI do the heavy lifting.
What are the features of Rows?
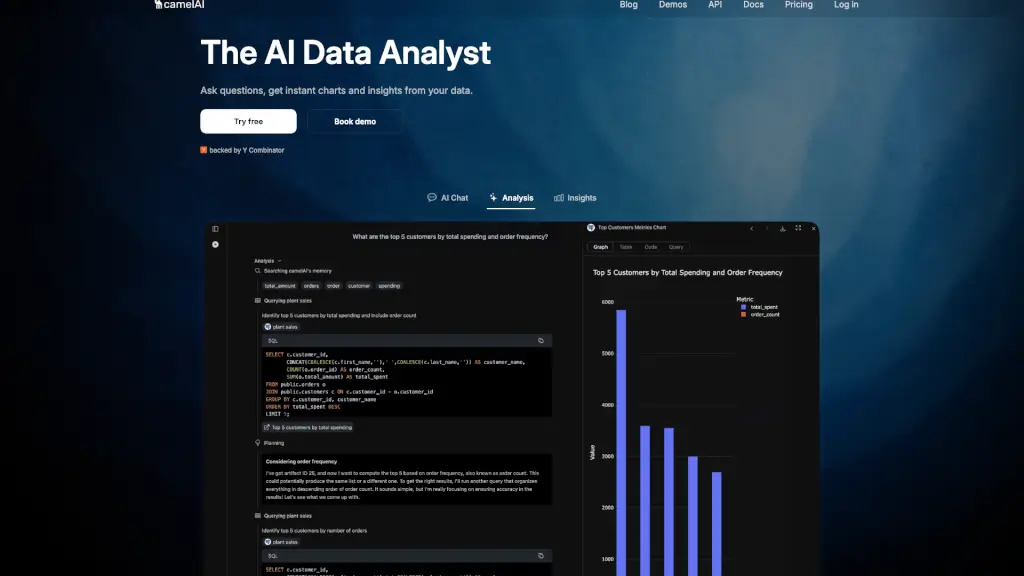
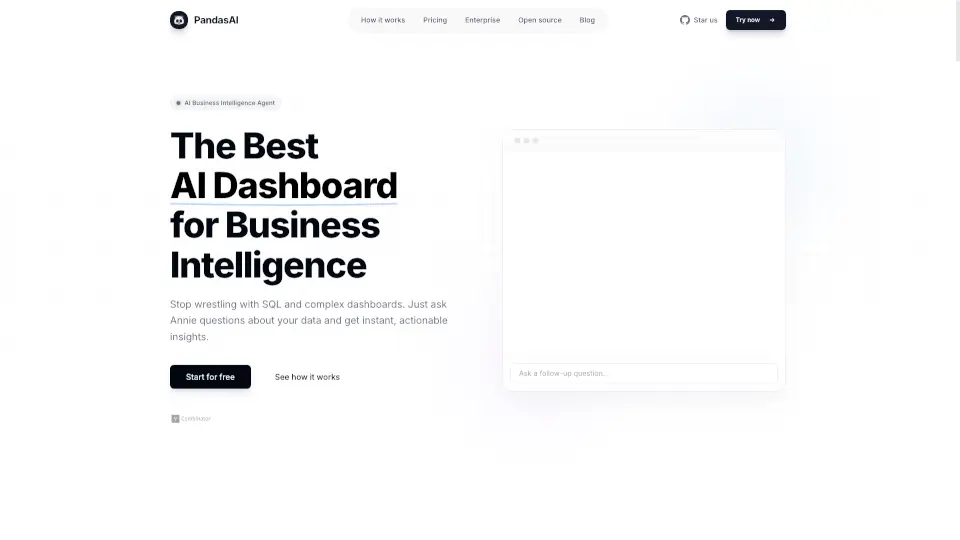
- AI-Powered Data Analysis: Ask questions in natural language (like “What were my top-selling products last quarter?”) and get instant answers—no formulas or coding needed.
- Connect Any Data Source: Pull data directly from PDFs, bank accounts, Google Analytics, databases, APIs, Excel/Sheets, and more—all in one place.
- No-Code Data Transformation: Clean, merge, and reshape data using intuitive AI prompts instead of complex ETL pipelines or manual copy-pasting.
- Real-Time Collaboration: Share live dashboards and reports with teammates, clients, or stakeholders without exporting files or sending static screenshots.
- Instant Templates: Jumpstart common workflows like expense tracking, sales reporting, or inventory analysis with pre-built, customizable templates.
- Secure & Private: Enterprise-grade security ensures your financial and business data stays protected—Rows doesn’t store sensitive credentials.
What are the use cases of Rows?
- A small business owner connects their bank account and Shopify store to automatically track profit margins and cash flow each week.
- A marketing manager imports Google Ads and Meta Ads data into one sheet, then asks AI to compare campaign ROI across platforms.
- A freelancer extracts tables from client invoices (PDFs) and auto-calculates monthly earnings without manual data entry.
- A nonprofit pulls donor data from multiple sources to identify giving trends and forecast future contributions.
- A student analyzes public datasets for a research project by simply asking AI to clean and visualize key metrics.
- An e-commerce brand monitors real-time inventory levels by syncing warehouse APIs with sales data—and gets alerts when stock runs low.
How to use Rows?
- Go to https://rows.com/—no signup required to start exploring.
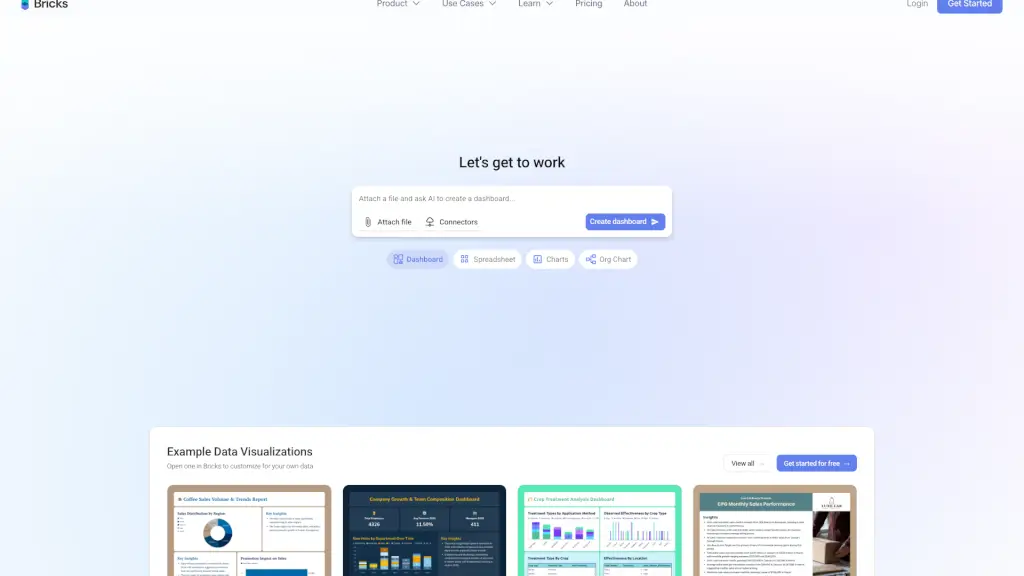
- Click “Create New Sheet” and choose a data source (e.g., upload a PDF, connect Google Analytics, or link a bank account).
- Once data is imported, type your question in the AI Analyst bar (e.g., “Show me monthly revenue by product”).
- Use AI suggestions to clean, filter, or combine datasets with simple prompts like “Remove duplicates” or “Merge with customer list.”
- Save your analysis as a live dashboard and share it via link—updates happen automatically as source data changes.
- Explore template gallery for quick-start solutions tailored to finance, marketing, sales, or operations.