What is Mokkup.ai?
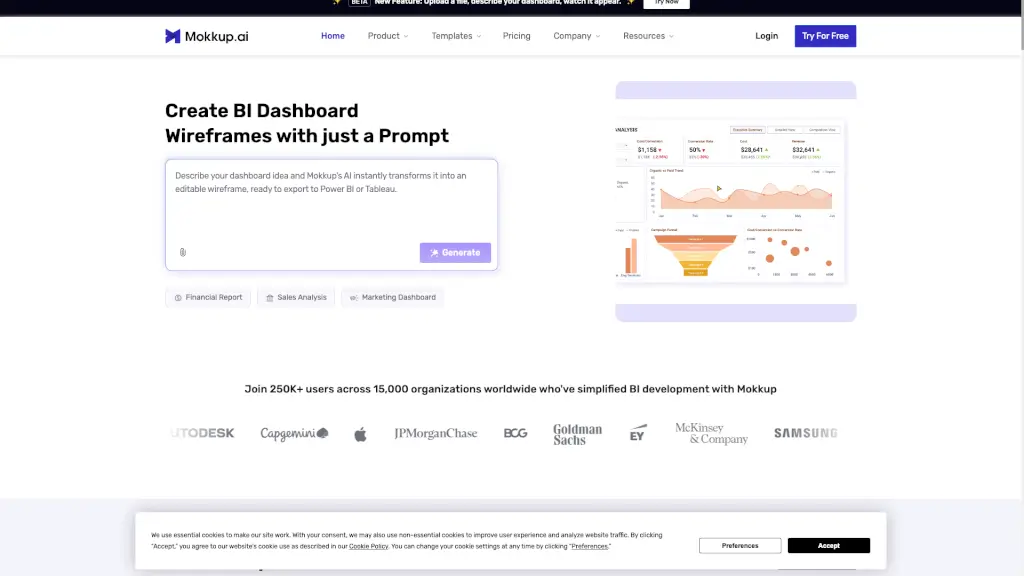
Mokkup.ai is an online wireframing tool built specifically for creating BI dashboard mockups—fast, easy, and without needing design or coding skills. Whether you're a data analyst, BI developer, or business stakeholder, Mokkup lets you turn ideas into professional-looking dashboard wireframes in minutes using simple AI prompts or drag-and-drop widgets.
What makes Mokkup stand out is its one-click export to Tableau and Power BI, complete with pre-configured metrics and layout fidelity. Instead of spending days sketching reports or waiting for dev cycles, teams can prototype, collaborate, and finalize designs before writing a single line of code—cutting development time by up to 30% and boosting client satisfaction.
What are the features of Mokkup.ai?
- AI-Powered Dashboard Builder: Describe your dashboard in plain English (or upload a file), and watch AI generate a wireframe instantly.
- 850+ Prebuilt Templates: Jumpstart your design with industry-specific templates for finance, sales, marketing, operations, and more.
- One-Click Export to Tableau & Power BI: Seamlessly transfer your wireframe—including layout, visuals, and dummy data—directly into your BI tool.
- Semantic Layer for Tableau: Exports come preloaded with measures, dimensions, and formulas, so developers can build faster.
- Real-Time Collaboration: Invite teammates to comment, edit, and refine wireframes together in real time.
- No Data Required: Create high-fidelity mockups using placeholder data—perfect for early-stage planning and stakeholder alignment.
- 20+ Drag-and-Drop Widgets: Customize charts, tables, KPIs, and filters with intuitive controls and professional styling.
What are the use cases of Mokkup.ai?
- A marketing team quickly prototypes a campaign performance dashboard before the sprint planning meeting.
- A consultant co-creates a financial report layout with a client during a live call, then exports it directly to Power BI for development.
- A BI developer uses Mokkup to visualize requirements from stakeholders, reducing back-and-forth and rework during implementation.
- An operations manager builds an inventory tracking mockup to align cross-functional teams on key metrics before data modeling begins.
- A product owner tests multiple dashboard layouts to decide which KPIs best support user goals—without involving engineering.
- A student or freelancer creates portfolio-ready BI mockups to showcase data storytelling skills.
How to use Mokkup.ai?
- Start by typing a simple prompt like “Create a sales dashboard showing monthly revenue and regional performance.”
- Or choose from 850+ templates and customize colors, widgets, and layout using drag-and-drop tools.
- Invite teammates via shareable link to add comments or make edits in real time.
- Refine your design using the AI conversation feature—just ask for changes like “Add a customer churn metric” or “Make it mobile-friendly.”
- When ready, click Export to Tableau or Export to Power BI—your wireframe arrives as a ready-to-build template.
- No need to connect real data; use built-in dummy datasets to simulate realistic visualizations.